Using Dashboards
The CodeTogether portal features four dashboards designed to provide essential software engineering intelligence for monitoring and optimizing your projects. Each dashboard presents data through graphs, burnup charts, and lists with drill-down capabilities, offering the most relevant insights for your team.
Opening the CodeTogether Portal
- Log in to CodeTogether, and then click the Dashboard button in the CodeTogether view.
- Alternatively, use the appropriate URL:
- For cloud-based (SaaS) users: https://app.codetogether.com
- For On-Premises users: Use the custom URL provided by your system administrator.
Key Components
This section covers key components you'll find on multiple dashboards in the CodeTogether portal.
KPIs
Key Performance Indicators (KPIs) in software engineering are essential for tracking team performance, project progress, and process efficiency. These KPIs appear on various dashboards, providing real-time, actionable insights.
CodeTogether tracks the following KPIs:
Team Engagement—Measures active team participation, expressed as a percentage comparing daily engineering hours to a target baseline. The target defaults to 2.5 hours/day/engineer but can be customized. Individual contributions are capped to prevent disproportionate workloads from skewing the metric, ensuring an accurate and fair reflection of engagement. This metric helps maintain strong team alignment and morale, while also providing insights into workload distribution, ensuring that no team member is overburdened.
Team Productivity—Assesses how effectively the team delivers final, reviewed code relative to time spent, balancing productive efforts (e.g., coding, unit tests) and inefficiencies (e.g., excessive pull request iterations, code churn). For connected projects, the calculation adjusts actual coding outcomes against a target coding rate, accounting for exploration time and inefficiencies. For non-connected projects, tasks are evaluated without considering pull request iterations. By tracking productivity, teams can pinpoint inefficiencies, optimize workflows, and improve the quality and speed of their code delivery.
Cycle Work Effort—Measures the average engineering time invested per issue to complete it, offering insights into task duration from start to finish. For connected projects, it reflects the average time spent resolving issues over past periods, with real-time updates for the current period. For non-connected projects, the metric tracks average time per completed task associated with a commit. This metric helps teams gain a clearer understanding of task duration, enabling more accurate planning and better resource allocation for future work.
Velocity—Measures the total estimated work delivered within a specific timeframe, providing a clear view of completed effort and helping predict future capacity. It sums the estimates from issues resolved over consecutive periods, such as weeks or sprints. For connected projects, it reflects completed estimates in past periods and dynamically updates for the current period. For non-connected projects, it tracks the number of commits completed during the same timeframe. Velocity allows teams to measure their capacity and predict future performance, making it easier to plan for upcoming work and optimize resource utilization.
Throughput—Tracks the total number of work items completed by the team within a given period, offering a straightforward measure of output without factoring in effort estimation. For connected projects, it counts resolved issues during each period, dynamically updating for progress in the current timeframe. For non-connected projects, it counts completed tasks. Throughput helps teams monitor progress, identify bottlenecks, and understand output trends, making it a valuable tool for improving team efficiency.
Estimation Accuracy—Evaluates how well actual delivery times align with initial time estimates, expressed as a percentage. Tasks completed close to the estimate receive a high score, while those deviating significantly receive a lower score. This metric is exclusive to connected projects and helps teams refine their estimation processes, improving predictability and resource planning over time.
Actionable Insights
AI-discovered insights that might negatively impact your project are listed. For further investigation, you can click a task description to drill down into the task log, or click a developer's name to drill down into their daily log.
Active Work and Recent Work
A number of dashboards include lists of Active Work and Recent Work, showcasing ongoing tasks and recently updated tasks.
For further investigation, you can:
- Click a task description to drill down into the task log for more details.
- Click a developer's name to access their daily log for insights into their activities.
Project Overview Dashboard
The Project Overview dashboard provides managers and team leads with a snapshot of project health. It consolidates critical information from other dashboards, offering an at-a-glance summary of progress and performance. Below is an outline of its key components:
- Current Sprint—Highlights the sprint risk level and includes burnup charts that provide a quick update on the sprint's progress, tracking tasks and story points.
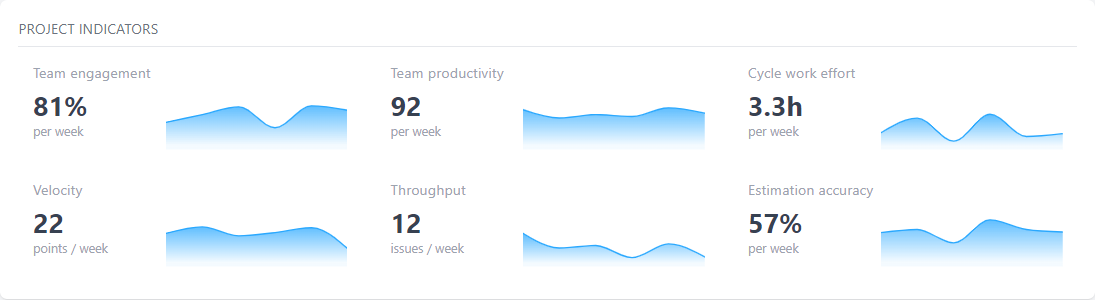
- Project Indicators—Displays essential project health metrics and trends, helping you evaluate the overall status and trajectory of your project.
- Active Work—Includes a list of active tasks associated with the project so you can maintain awareness of ongoing efforts.
- Recent Work—Provides a summary of recent contributions and updates for the project.
To view the Project Overview dashboard, select Project Overview from the sidebar in the CodeTogether portal.
Project Insights Dashboard
The Project Insights dashboard offers real-time analysis of your coding activity, giving you complete visibility into your development progress at all times. This dashboard features customizable graphs and data points, which can be tailored through project settings to meet your specific monitoring needs. Additionally, external integrations, such as linking with Jira, can enhance functionality, providing a more comprehensive view—like the On-Time Delivery graph.
To view the Project Insights dashboard, select Project Insights from the sidebar in the CodeTogether portal.
The dashboard includes five tabs, each offering a snapshot of key project trends, with intuitive graphical representations. You'll also find KPIs and Actionable Insights.
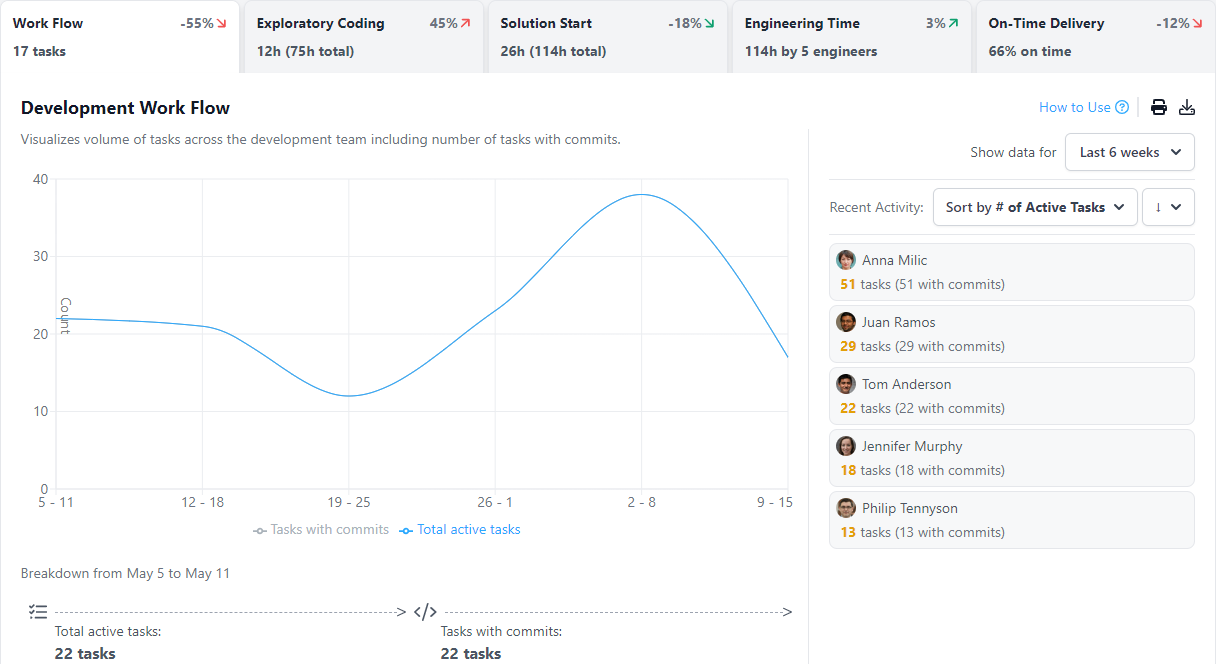
Work Flow Tab
The Workflow graph provides insight into team dynamics by visualizing task completion trends on a weekly or monthly basis. It can disaggregate tasks into components, illustrating not just quantities but also the areas in which tasks are completed. This dual perspective helps understand both throughput and the distribution of work across the software's architecture. Beside the graph, you get a list of individual developer contributions, offering a clear picture of productivity and pinpointing areas of high performance or potential bottlenecks. You can drill down on a developer directly from the list for a deep dive into their recent activity.
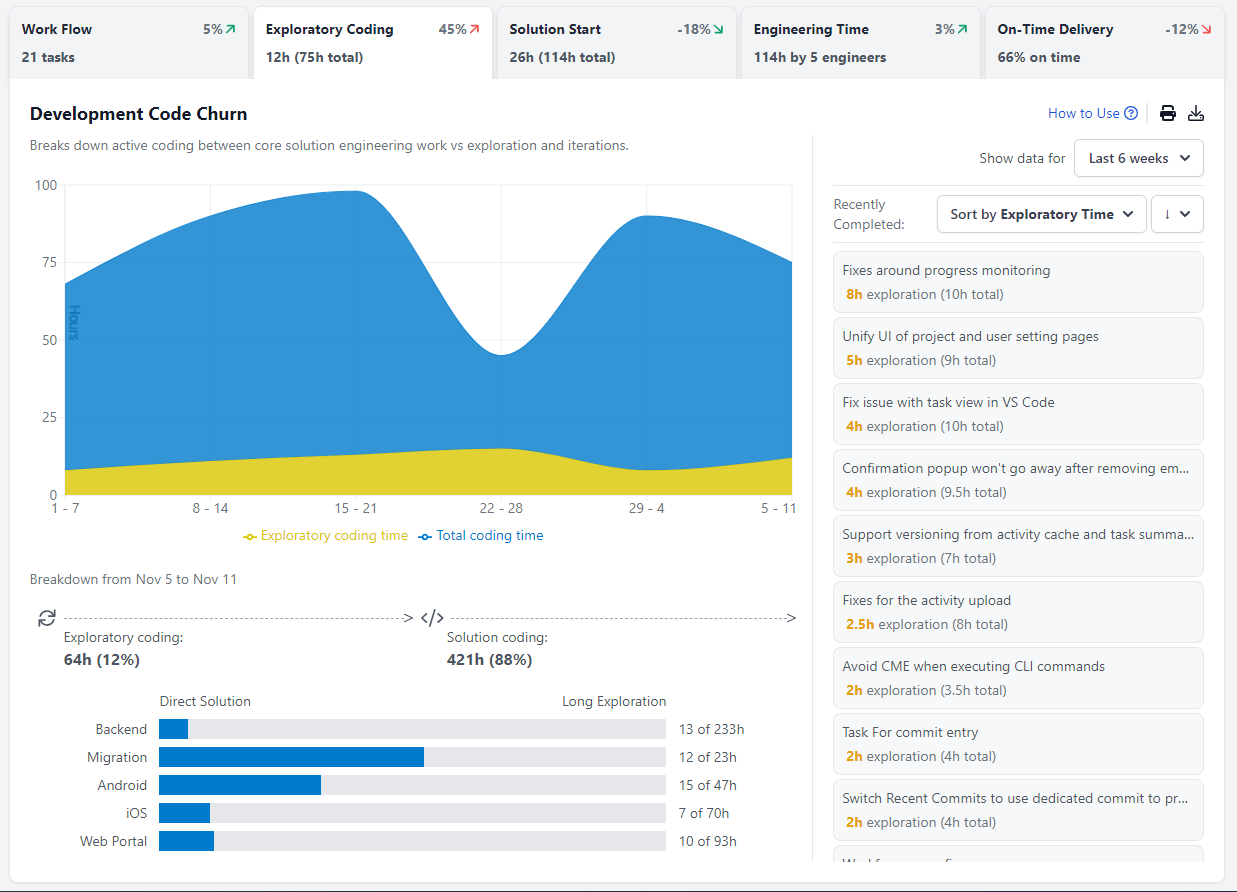
Exploratory Coding Tab
The Exploratory Coding graph demystifies code iteration processes, revealing the frequency and intensity of code churn—a measure of how often code is revised before it's deemed final. You can view this information on a weekly or monthly basis. Unlike traditional assessments at commit or review checkpoints, CodeTogether's Workflow AI analysis reveals churn during active development. By exploring component-level churn, users gain insights into code complexity and identify components requiring excessive rework, guiding efforts to streamline development in these areas. To the right of the graph, you'll see a list of recent tasks. You can sort this list by exploratory time or overall time, and then drill down to view the corresponding task log.
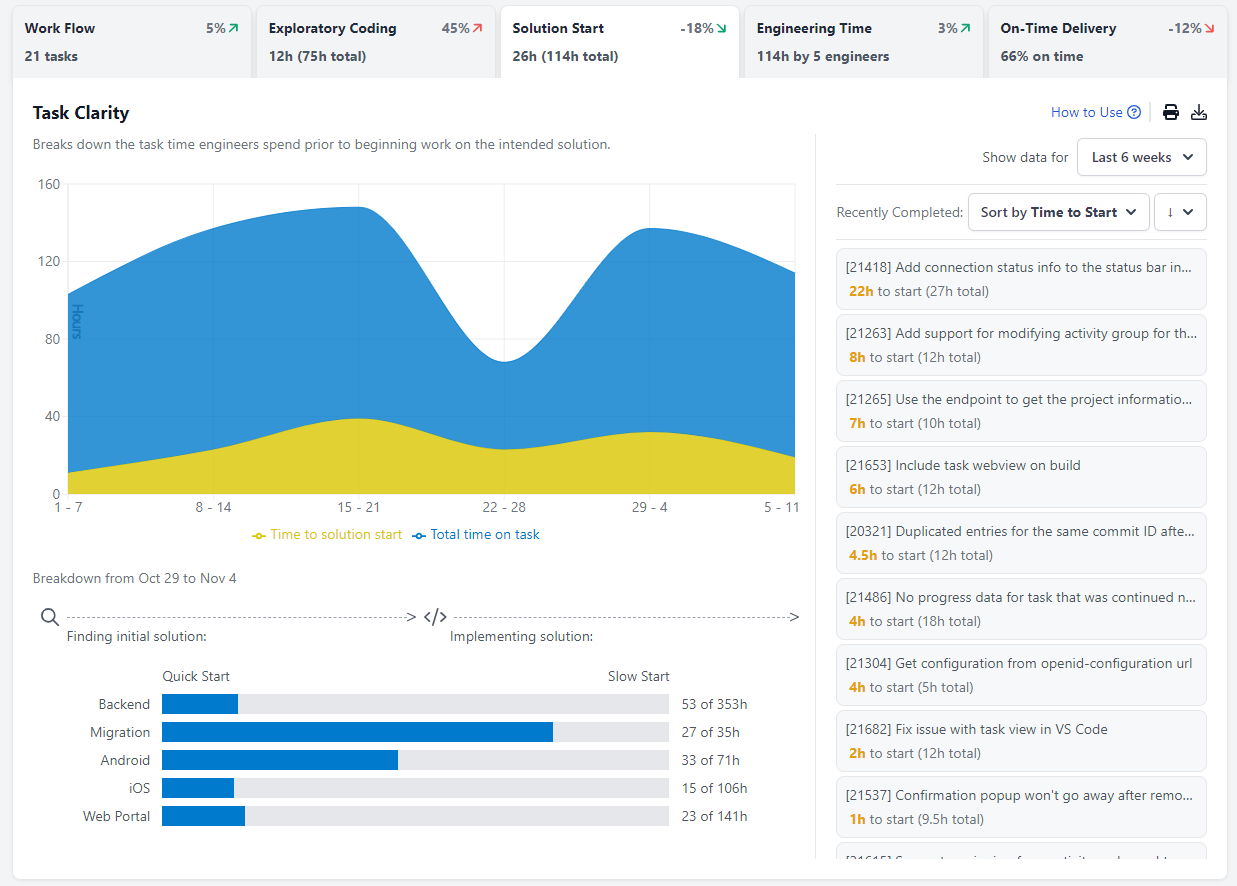
Solution Start Tab
The Solution Start graph focuses on the initiation phase of tasks, analyzing how swiftly developers embark on them. You can view this information on a weekly or monthly basis. Estimating when foundational work begins facilitates understanding of task distribution efficiency. Identifying components or tasks with delayed starts offers valuable intel on process bottlenecks. It might suggest the need for clearer definitions or a reevaluation of requirement gathering processes. Observing patterns in components can spotlight areas that are inherently more challenging. To the right of the graph, you'll see a list of recent tasks. You can sort this list by time to start or overall time, and then drill down to view the corresponding task log.
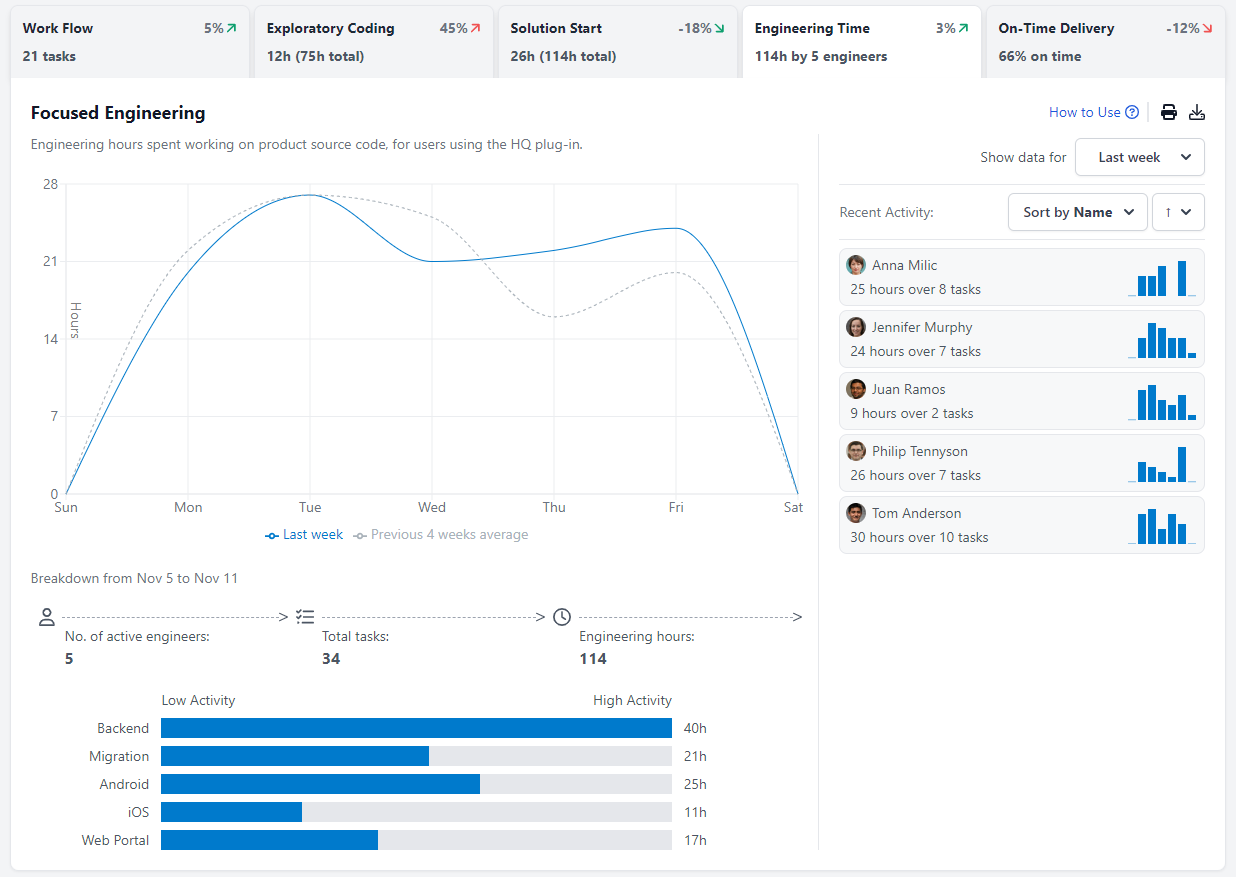
Engineering Time Tab
The Engineering Time graph sheds light on when and where focused engineering occurs. By splitting engineering time across days and components, one can discern peak productivity periods and high-attention areas within the product codebase. You can view the information on a daily basis, using this week or last week; or on a weekly basis for the last six weeks. This intel catalyzes strategic planning, such as minimizing meetings during high productivity blocks, and nurturing an environment conducive to focused, uninterrupted engineering work. Beside the graph, you get a list of individual developer contributions, offering a clear picture of productivity and pinpointing areas of high performance or potential bottlenecks. You can drill down on a developer directly from the list for a deep dive into their recent activity.
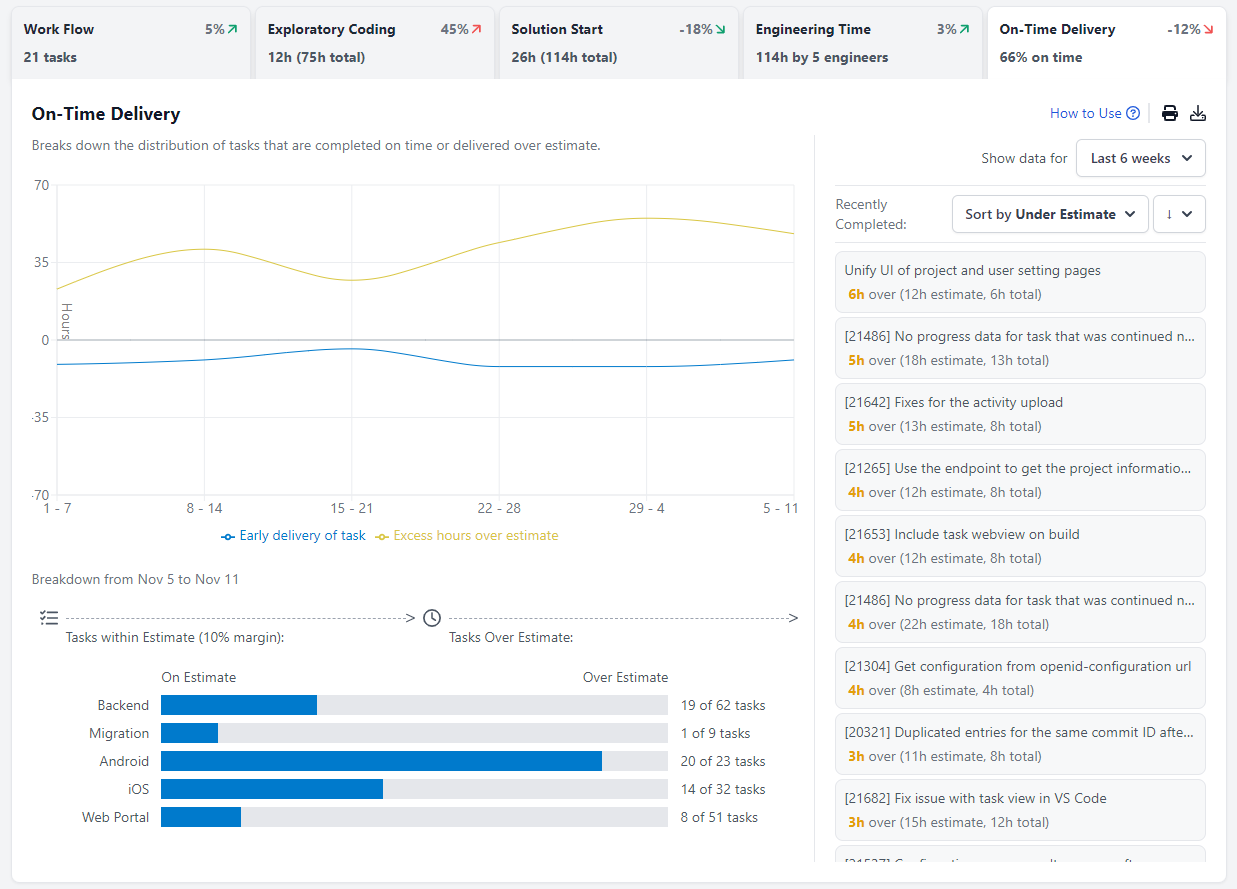
On-Time Delivery Tab
The On-Time Delivery graph becomes actionable with integrations like Jira. It tracks task completion against estimates, providing a feedback mechanism into project management platforms. You can view this information on a weekly or monthly basis. CodeTogether's meticulous tracking allows for a detailed analysis of how each component aligns with planned timelines.
Dissecting overdue areas facilitates refined task estimation and forecasting, bolstering the chances of meeting project deadlines and achieving on-time delivery of products.
Sprint Progress Dashboard
The Sprint Progress dashboard helps you track and optimize sprint performance by connecting developers' active coding with issues tracked in tools like Jira or GitHub. With CodeTogether, you gain actionable insights to keep your sprint on track.
To view the Sprint Progress dashboard, select Sprint Progress from the sidebar in the CodeTogether portal.
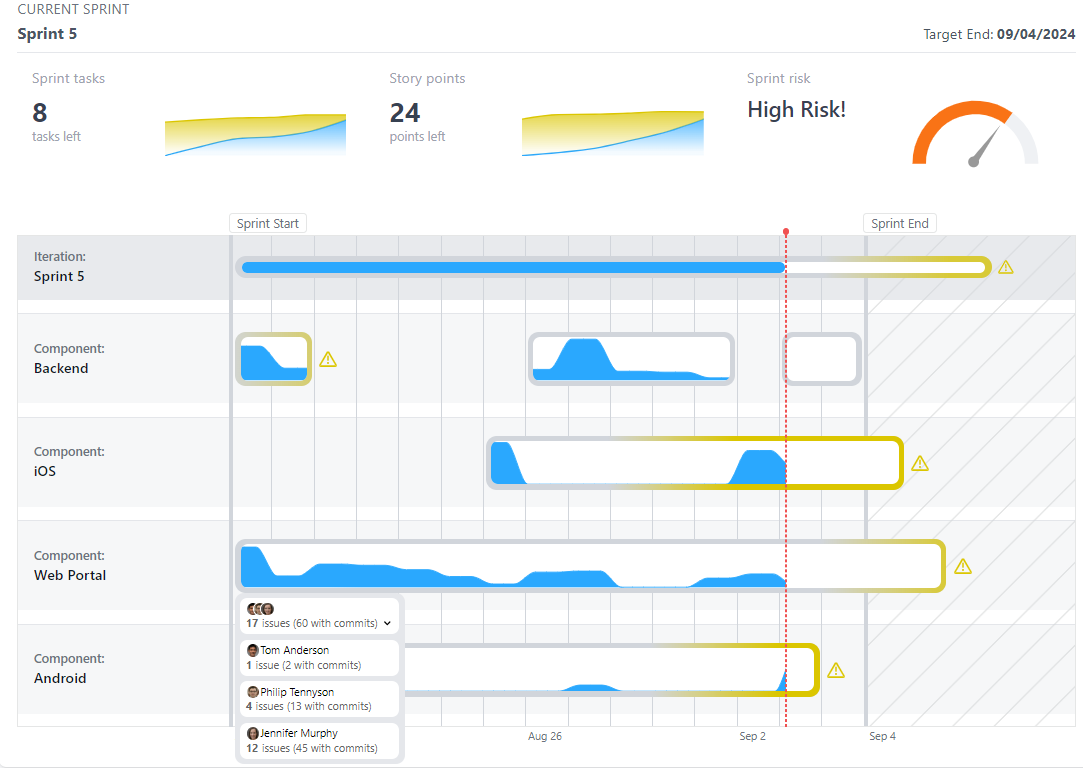
The Sprint Progress dashboard includes burnup charts, a risk indicator and a timeline highlighting task activity by component. You'll also find KPIs, Actionable Insights, Active and Recent Work.
Burnup Charts
Burnup charts provide a clear view of project progress, tracking completed work against the total planned work over time. The Sprint Progress dashboard includes two burnup charts.
- Sprint tasks—Based on tasks for granular insights into daily progress and task-level completion.
- Story points—Focuses on broader progress and velocity for a high-level view of overall sprint goals and performance. Story points are based on your estimation model to allow for better sprint planning. CodeTogether supports story points, t-shirt sizing, and time buckets out of the box, and offers flexibility for tailored approaches.
Risk Indicator
The Risk Indicator combines Team Engagement, Team Productivity, Remaining Velocity, and Cycle Work Effort into a weighted score to assess the likelihood of meeting project goals. Each component is evaluated against a baseline, with current performance or remaining workload determining its risk rating. These ratings are averaged to produce an overall risk score, classified into four levels: Low, Medium, High, and Very High.
Timeline
The timeline visualizes the current iteration's status alongside task activity grouped by component. Key features include:
- Yellow Shading to flag missed targets.
- Indicators for when the sprint may run beyond its end date, allowing for early intervention.
- A graph within each task to track activity trends, highlighting dips that may need attention.
For deeper context, drill down into tasks to view associated issues and the engineers involved.
Code Flow Dashboard
The Code Flow dashboard enhances team transparency, allowing developers to follow each other's work in real-time across. This visibility strengthens collaboration—whether working across time zones, aligning on tasks, collaborating on an API, or running more effective scrums with real-time data to guide discussions. You can create activity groups within a project to subdivide the team and focus on specific tasks.
To view the Code Flow dashboard, select Team Code Flow from the sidebar in the CodeTogether portal.
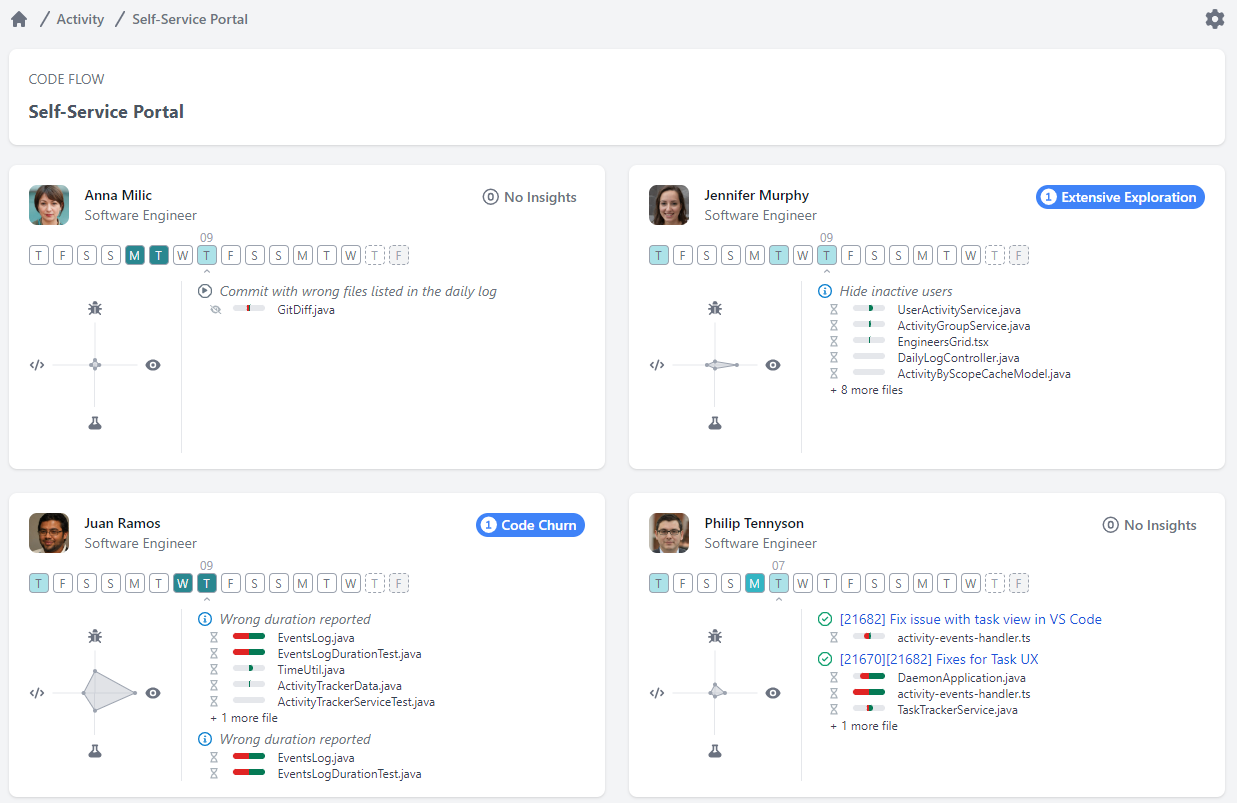
Actionable Insights
If CodeTogether's AI detects any specific areas needing attention for a developer, it includes the insight next to the developer's name.
Daily Work Timeline
A timeline is included for each developer. The timeline offers a visual representation of daily work efforts, with darker shading indicating higher activity levels. Navigate to dates that align with anomalies identified on the Project Insights dashboard to investigate root causes.
Radar Graph
Below the timeline is a radar graph that offers insights into the developer's focus during a given day. Use the radar graph to quickly visualize how time was allocated across coding, debugging, exploring, and testing.
Recent Activity
For each developer, you can see a list of recent activity. This section shows both committed and in-progress activities of the developer. Click the task title to drill down and obtain more details, including all the files changed. CodeTogether also provides visualizations for the type of work performed, such as time spent browsing or coding. Having visibility into the amount of time spent allows you to enhance code review and focus on reviewing the most challenging code portions.