CodeTogether AI 2026.09.13 release notes
Release 2026.09.13 reshapes the work area tab strip, rebuilds the developer profile, and moves work area access grants onto the Settings pages that already list your people. Read the first change first: a dashboard you have bookmarked kept its address but changed its name.
- Release: 2026.09.13
- Deployment: SaaS and on-premises, except where a change names one
- Role: any portal user, except where a change names a role
Red outlines in the figures are annotations that mark what changed. They are not part of the product.
Work area dashboards
A work area opens on five tabs, and Activity is now Flow

The delivery dashboard you knew as Activity is labeled Flow. It kept its address
(/workflow) and every calculation, so saved links and bookmarks open the same dashboard,
but a different dashboard holds the Activity label now. Three tabs join it: Home, a
one-screen summary that a work area opens on; Activity, a grid of the directories the
team worked in; and Tracking, an Owner and Admin roster of who is capturing.
The company-wide All Areas scope shows Flow, Tooling, Tracking and the AI Adoption Report, with no Home tab. It shows an Activity tab only while no other work area exists, because a company-wide directory grid is the union of every area's directories.
Home summarizes a work area on one screen
Home leads with four observed-work tiles - Contributors observed, Commits observed, Merges observed and Agentic spend - then the repositories ranked by captured commits, then how the work got done. A tile with a measure drills into the tab that explains it and opens that tab on the same period. Merges observed reads Unavailable in this release on every work area, because nothing captured counts merges yet.
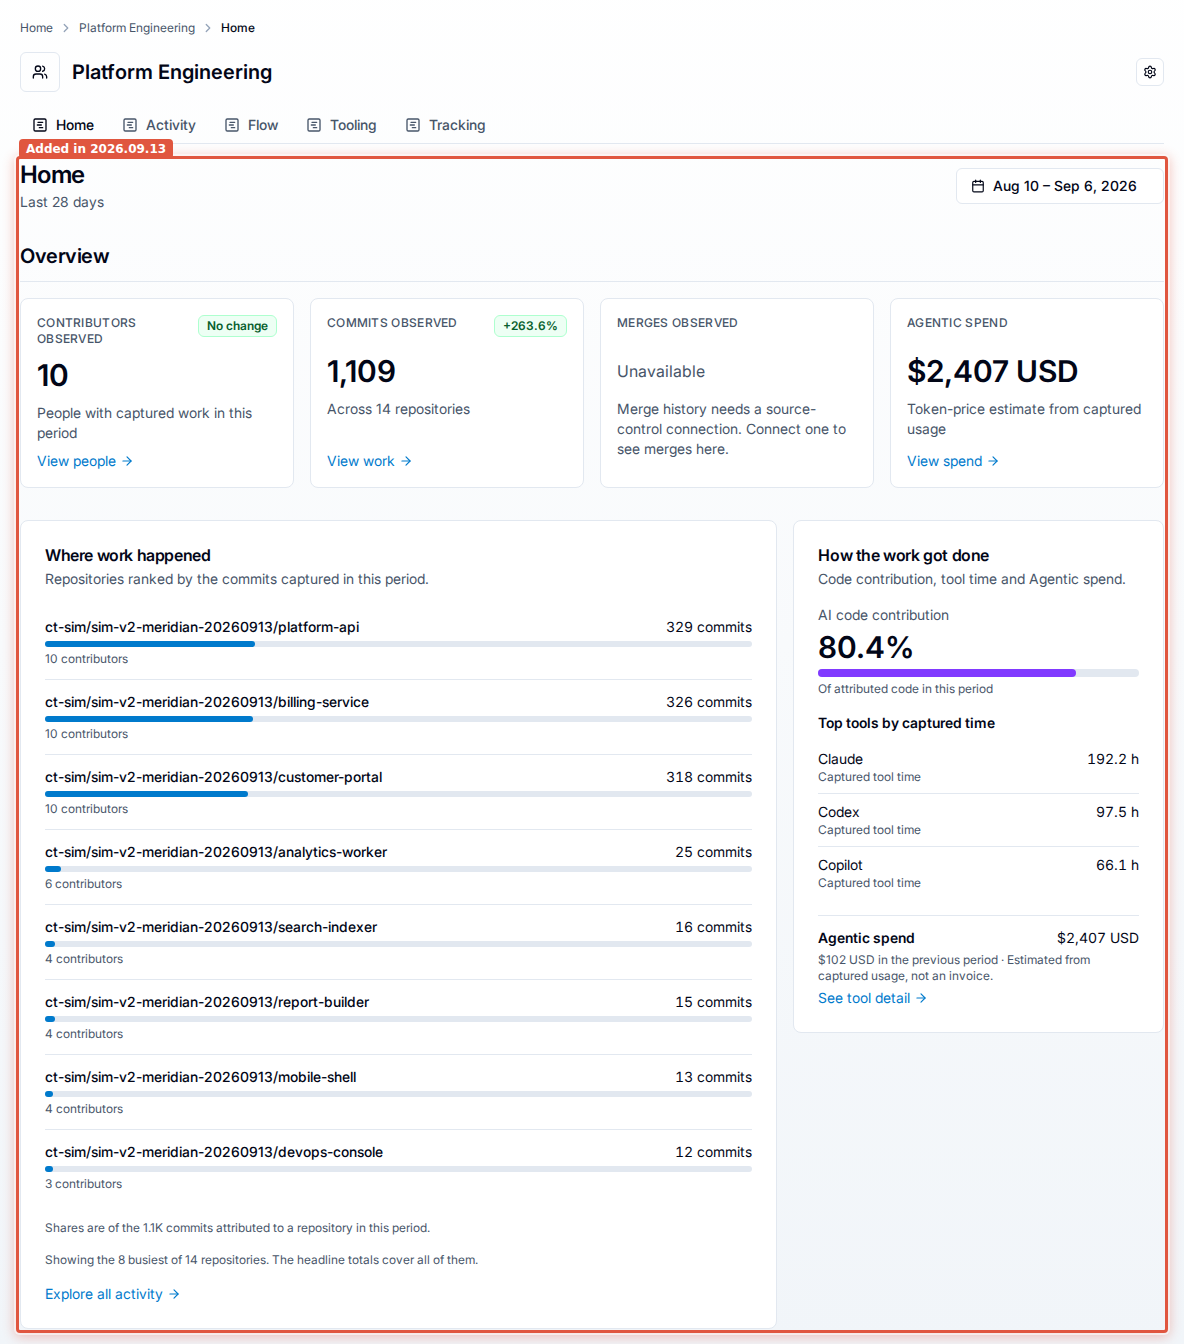
Activity shows where in the code the team worked
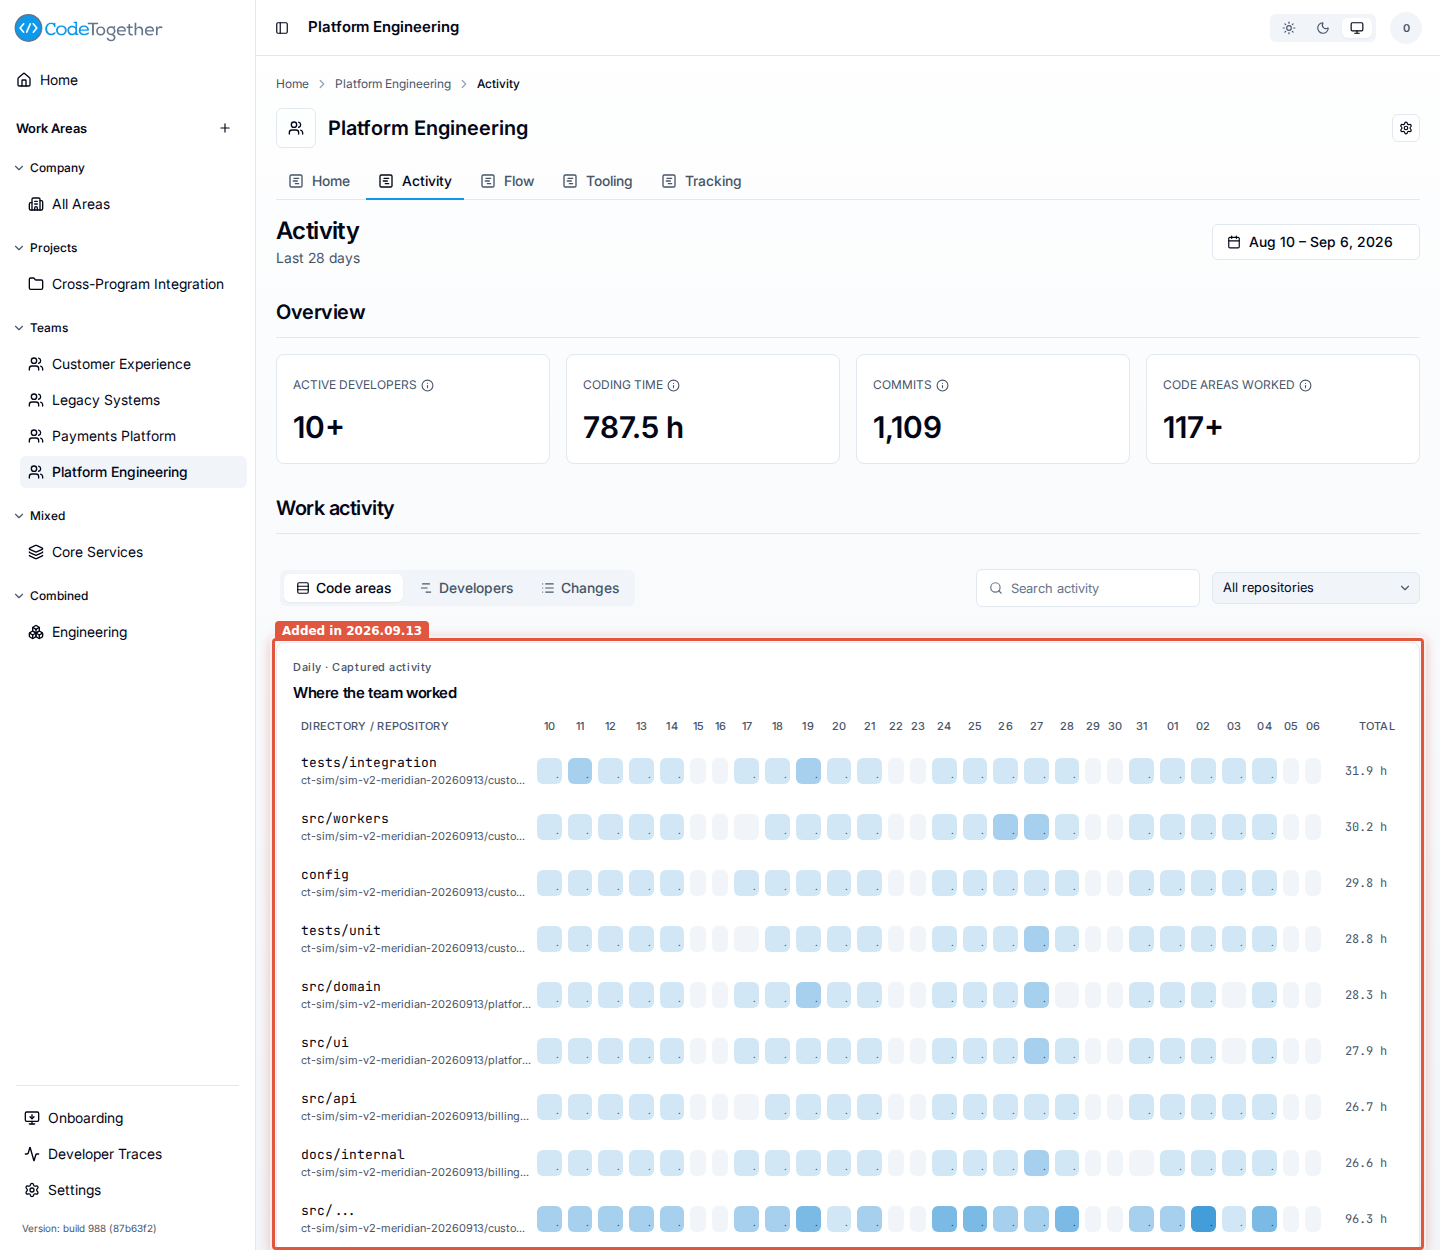
Activity answers which parts of the code the team worked in. Its Where the team worked grid has views for Code areas, Developers and Changes, a search box and a repository filter; columns are days for a range of 28 days or less and ISO weeks beyond that. Its Overview tiles are Active developers, Coding time, Commits and Code areas worked. On a work area scoped to repositories the time tile reads Repository coding time and counts a block once per repository.
Flow renames one tile, adds one, and drops one
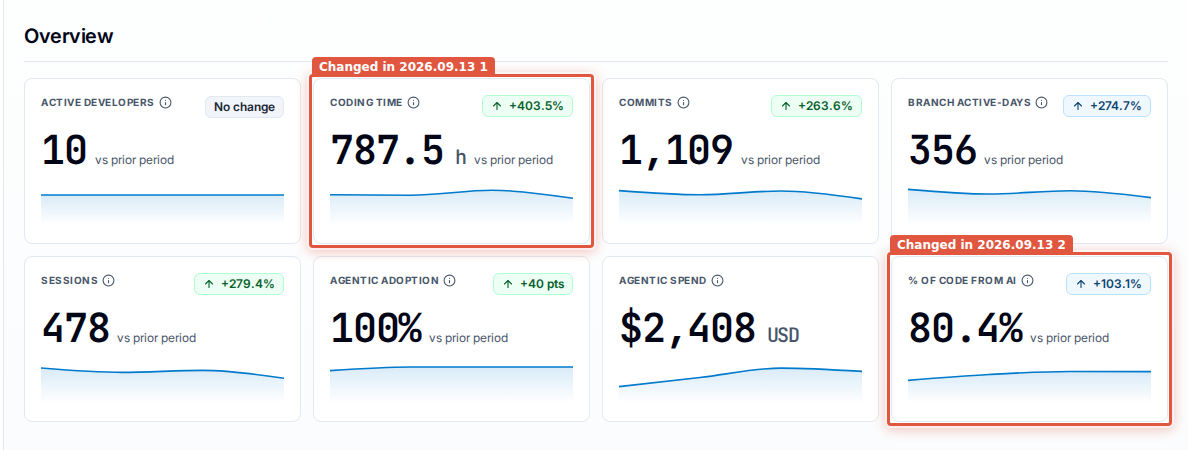
The strip still carries eight tiles. Total coding time is Coding time, and it reports a different measure: an elapsed clock in five-minute blocks that never double-counts overlapping sessions, rather than the earlier effort sum. A % of Code from AI tile joins the strip with a relative-change badge. The Stale work tile is gone from Flow; the measure still appears on the developer profile.
Tooling reports the same coding-time clock
The Tooling overview tile labeled Active time is labeled Coding time and binds the shared clock, so the same number reads the same way on Flow, on Tooling and on the organization Home page. Active time survives on Tooling as the per-tool usage toggle and the roster column, where it is still an effort sum of session minutes.
Home and Activity joined the shared date range
Home and Activity gave up the seven-day windows they each kept and joined the range every report page shares, with its four-full-weeks default and its 14-day minimum. A period chosen on Flow or Tooling reaches them too. Dashboards now default to the last four complete Monday to Sunday weeks.
The organization Home page reorders itself
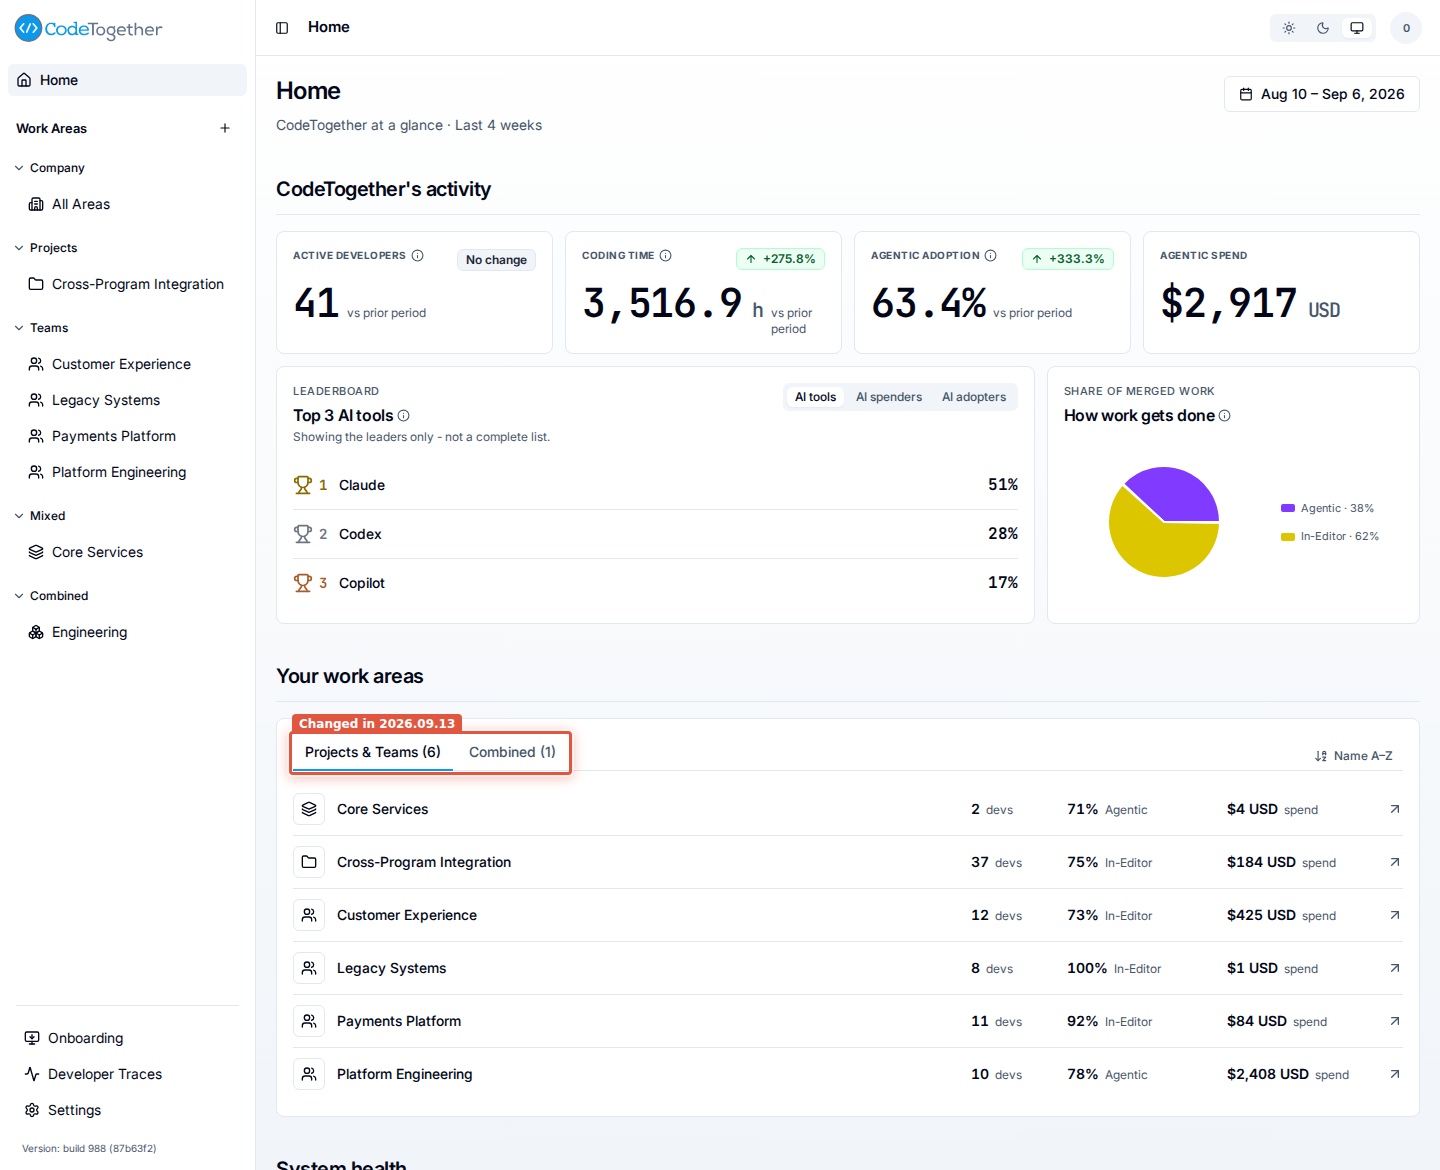
Your work areas groups its rows under Projects & Teams and Combined, replacing one tab per work area type. For administrators, System health renders after the activity and work area sections instead of leading the page, so its tiles are at the foot of the page. The organization tiles read Agentic spend, and the Home tile labeled AI adoption is Agentic adoption, the same measure Flow reports.
Smaller changes on the dashboards
- Money renders as
$2,470 USD: whole units, with the currency code after the figure, and two decimals only below one unit. - A measured zero delta reads No change, and a tile with no prior period shows no badge at all.
- The Flow and Tooling developer rosters list work areas instead of people on a combined work area, and on All Areas whenever other work areas exist and more than 20 developers are in scope.
- A Tooling roster spend figure priced from tokens rather than reported by the vendor carries an estimate marker.
- The Tooling tool-mix trend draws one line per tool at its own share of the period's prompts, and the In-Editor slice of the work-model split is yellow.
- The Flow developer roster dropped its Spread-thin column.
- The Work health section on Flow is Work status. Its Work in flight, Needs attention, Team utilization and Quality signals widgets are gone, and Review & merge flow states its reason when the deployment cannot measure it, instead of rendering empty.
The AI adoption report
AI-Authored Share replaces Efficient Agentic Usage
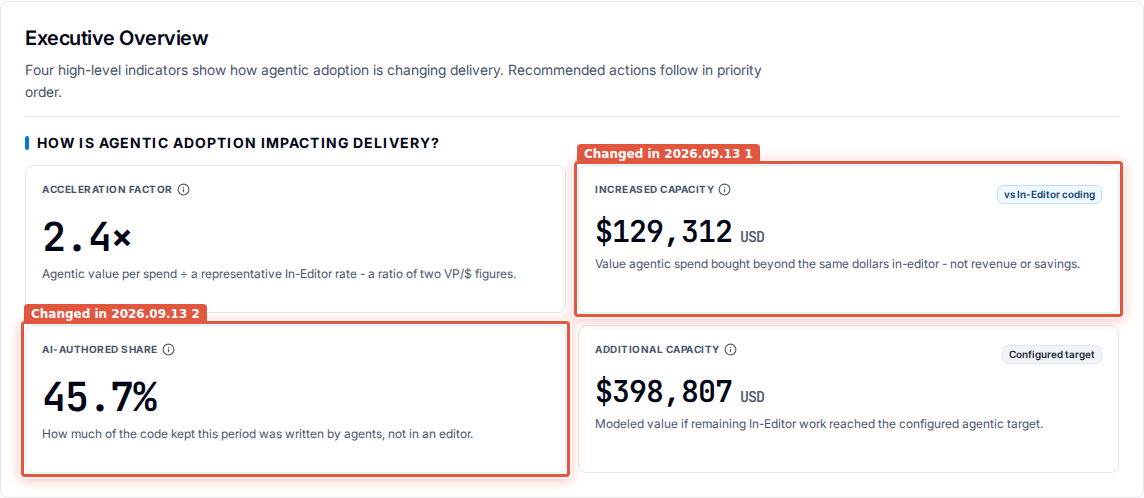
Efficient Agentic Usage is AI-Authored Share: it reads how much of the code kept in
the period agents authored, and it carries no target, because it describes composition
rather than a goal. Increased Capacity is no longer floored at zero, so a period that
ran below the comparison basis reads as a negative amount instead of $0, and the tile
states the basis it was measured against.
The adoption funnel counts every developer once
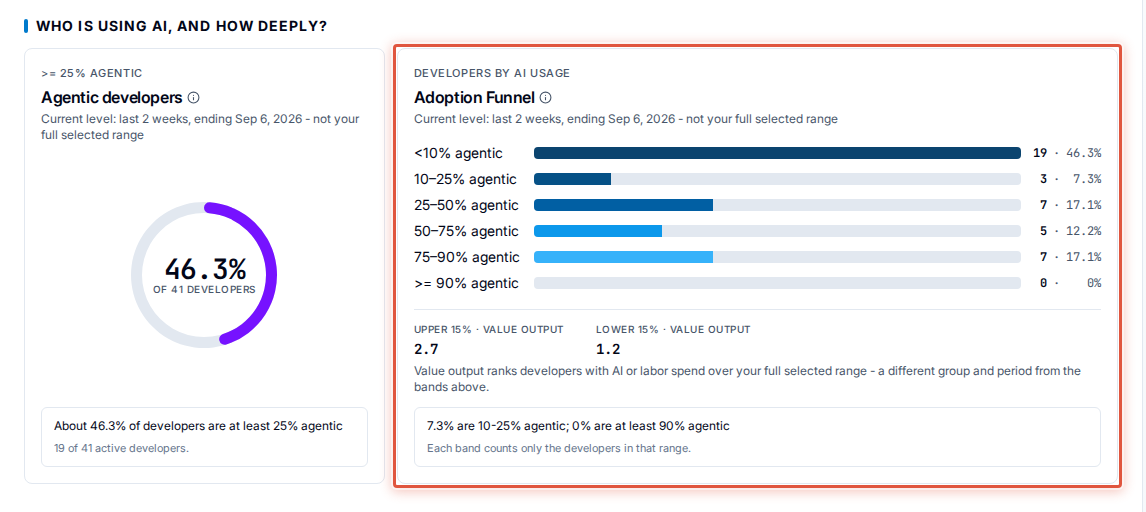
The funnel's stages were cumulative tiers drawn as a trapezoid. They are six bands that each count only the developers inside their own range: under 10% agentic, 10-25%, 25-50%, 50-75%, 75-90%, and 90% or more, drawn as proportional bars scaled against the largest band. The bar that read Total developers is gone, because the bands already sum to the funnel's population.
Beside it, the Agentic developers gauge counts a developer as agentic at 25% of attributable kept lines rather than 75%. It divides by all active developers, so a developer who was active but shipped no retained output stays in the denominator. A baseline recorded before this release is not comparable with one recorded after it; if you track this figure over time, start a new series from this release.
Every panel states the window and the population it counted
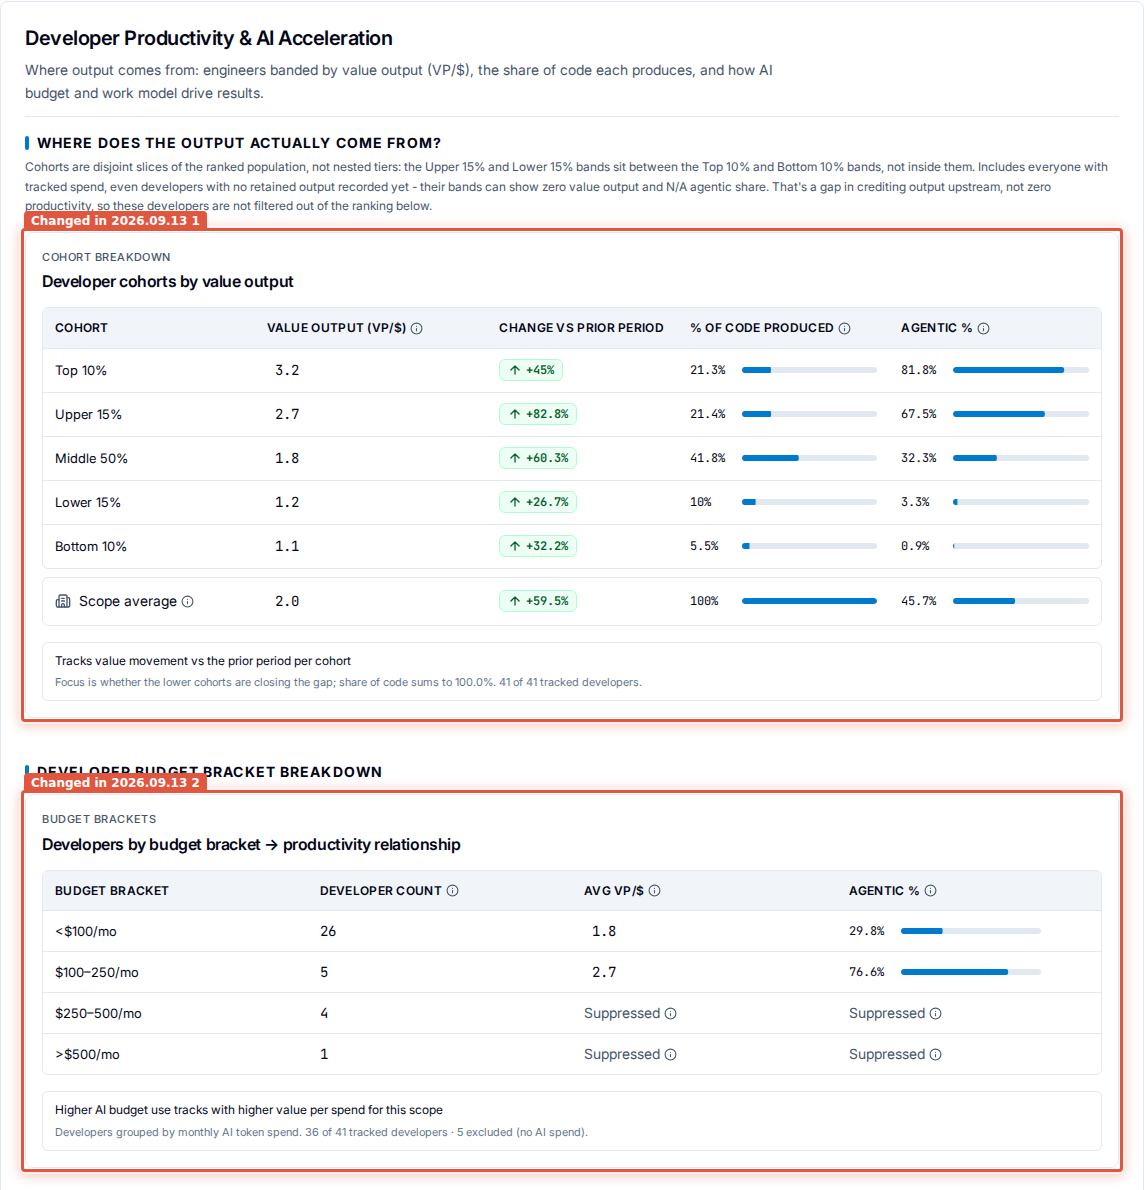
Cohort bands Top 25% and Bottom 25% are Upper 15% and Lower 15%, and the report says outright that the bands are disjoint slices rather than nested tiers. Every panel footer states the window and the population in one line, including how many developers were left out and why. The headline figures in State of AI Engineering Adoption read a shorter window than the range you select and say so above the number, and the trend charts shade that window and label the shading.
Work Areas Breakdown names how each area is scoped
The section is titled Work Areas Breakdown and its first column reads Work Area. A Type column names how each area is scoped, in the same vocabulary as the work area templates: Project, Team, Mixed or Combined. In the same section, the Output Efficiency trend chart draws a y-axis with ticks instead of hiding it, so you can put a number on the slope.
Across the report, period-over-period deltas share one formatter, so a whole-number change
reads +45% rather than +45.0%.
Developer profile and developer traces
The developer profile was rebuilt
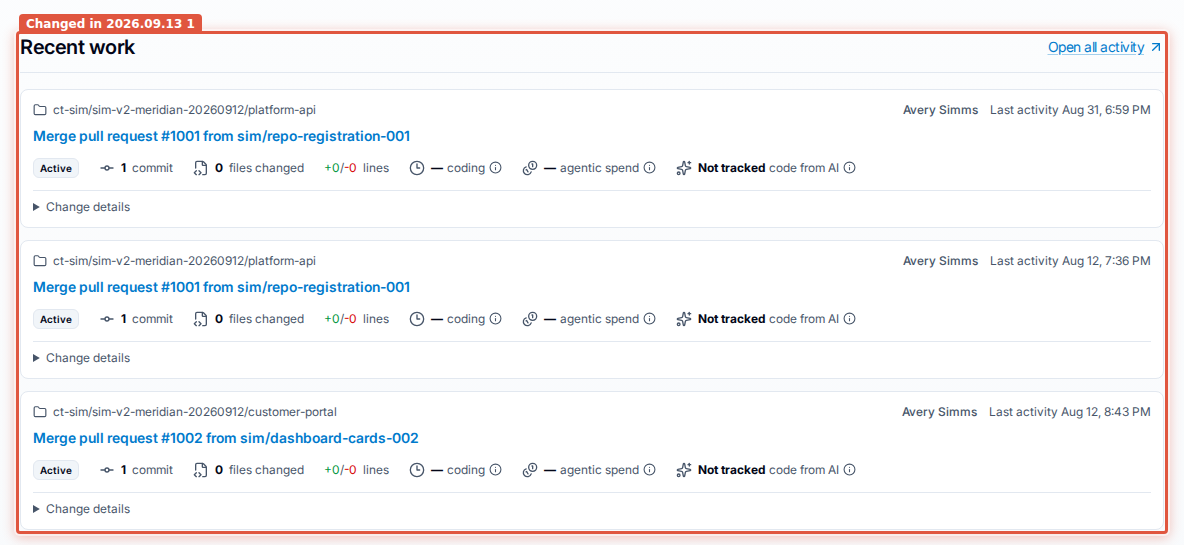
The profile leads with Recent work instead of work branches. Each change is a card carrying its commits, files changed, lines, coding time, agentic spend and share of code from AI, and Open all activity opens a Recent changes page listing every tracked change in the period. A code-areas card titled with the developer's first name maps captured time onto code areas, with a Repository and Work area toggle. Two sections went away, Where the effort went and Code quality, and Work and activity is Change volume.
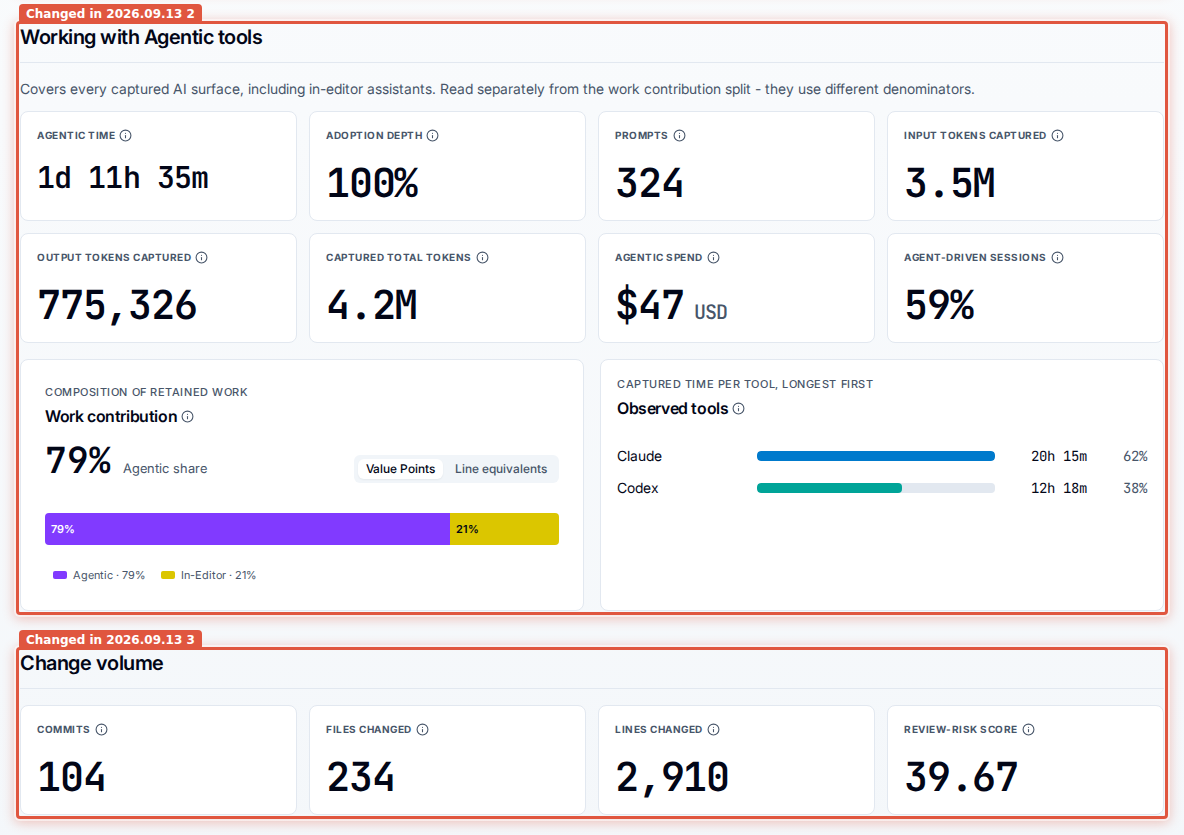
Working with AI is Working with Agentic tools, and the card inside it that splits captured time across tools is Observed tools, not Tool mix. The section states its own semantics: its tiles cover every captured AI surface, in-editor assistants included, and are read separately from the work contribution split, which is attribution of retained work. The two use different denominators.
Recent changes lists every tracked change for a developer
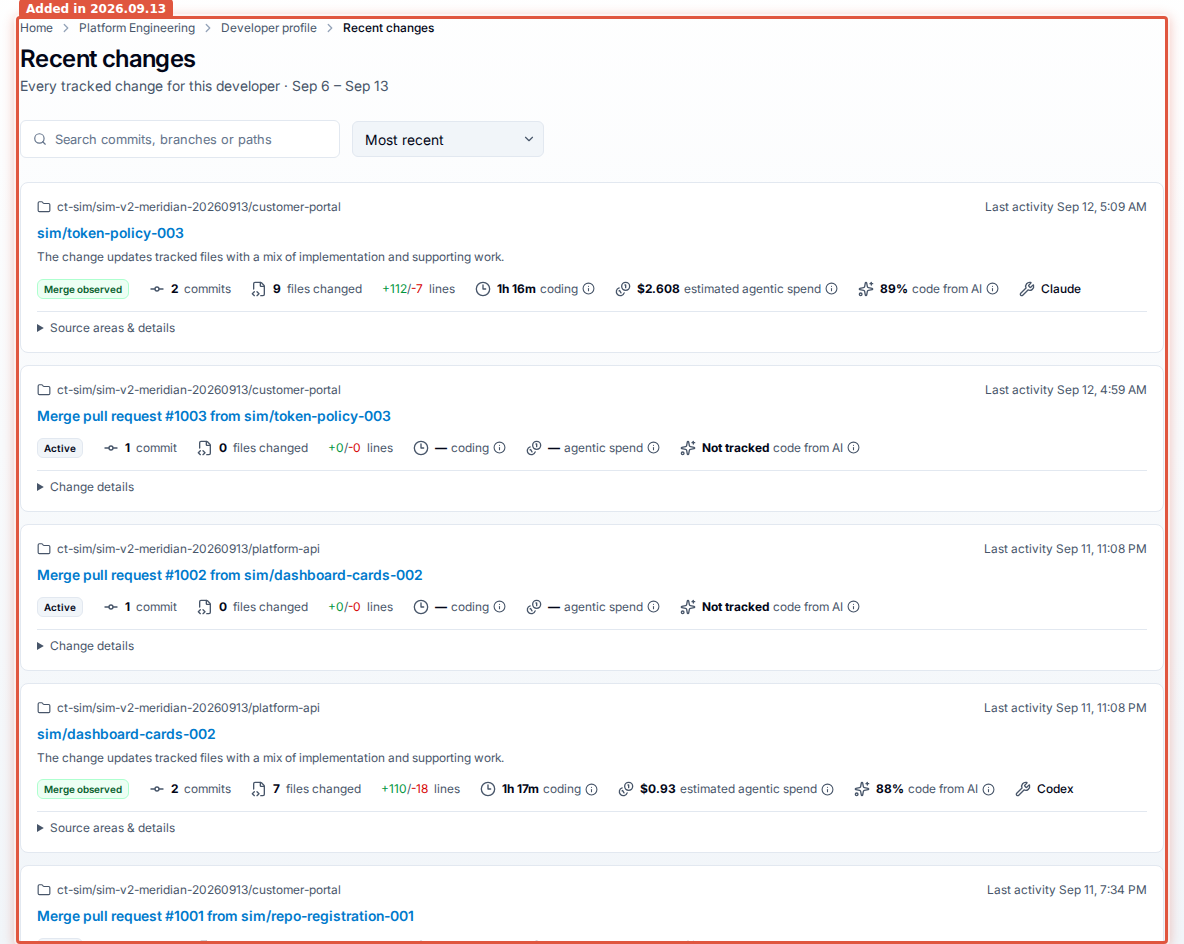
Recent changes is a new page, opened from Open all activity under Recent work on the developer profile. It lists every tracked change for that developer in the period, one card each, with the same commits, files changed, lines, coding time, agentic spend and share of code from AI that the profile's cards carry. Search commits, branches or paths narrows the list, the sort list offers Most recent, Most coding time and Largest change, and Load more fetches the next page of changes.
Developer Traces open on the last 7 days
Developer Traces, a developer's trace and a work-branch trace all open on the last 7 days including today. Before this release they followed the window the dashboards share, with its 14-day minimum. Two consequences when you are checking whether data arrived. The default period is shorter, so a developer missing from the roster may have been quiet this week. A period you set on a dashboard no longer follows you into the trace pages.
The roster Status pill reads recency, not volume
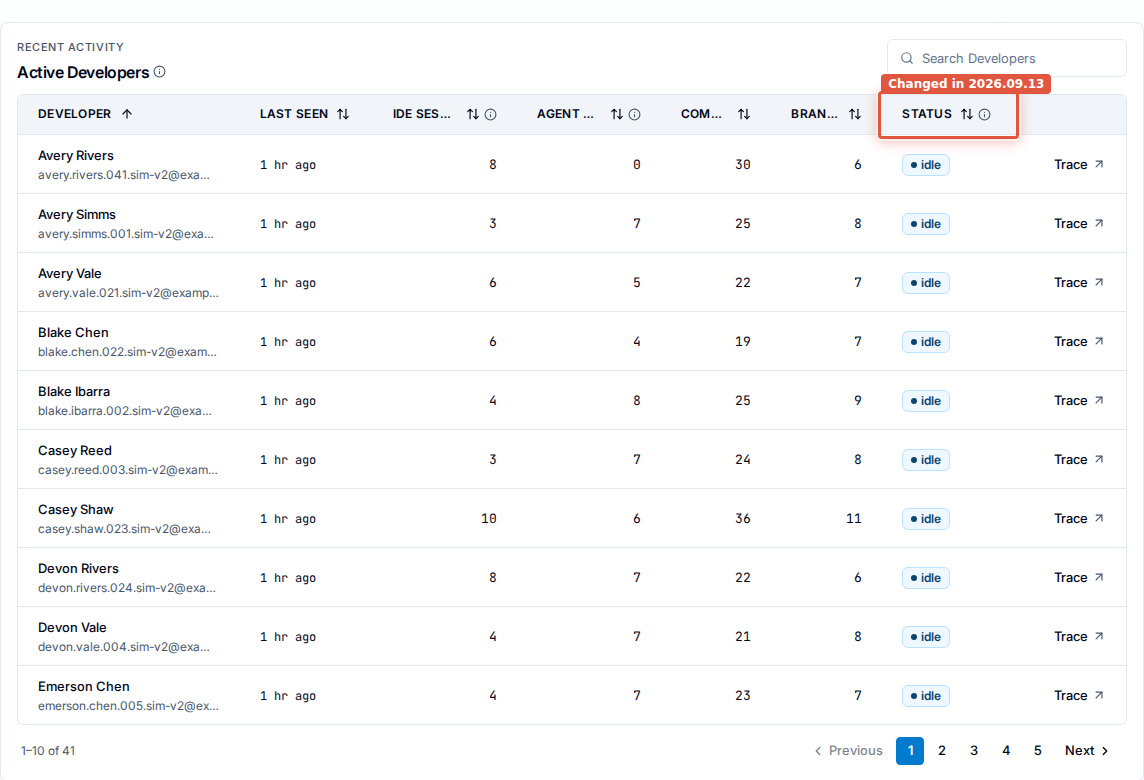
Status answers when a developer was last seen, not how much they committed: active under 30 minutes, idle 30 minutes to 2 hours, stale 2 hours or more, and unavailable when no activity timestamp exists at all. The column header carries an info icon stating the same thresholds. A developer with a full week of commits reads stale by the afternoon. The Last seen label also floors rather than rounds and is measured from the roster's own reference instant, so it can no longer disagree with the pill beside it.
Runtime Sessions says how each session was captured
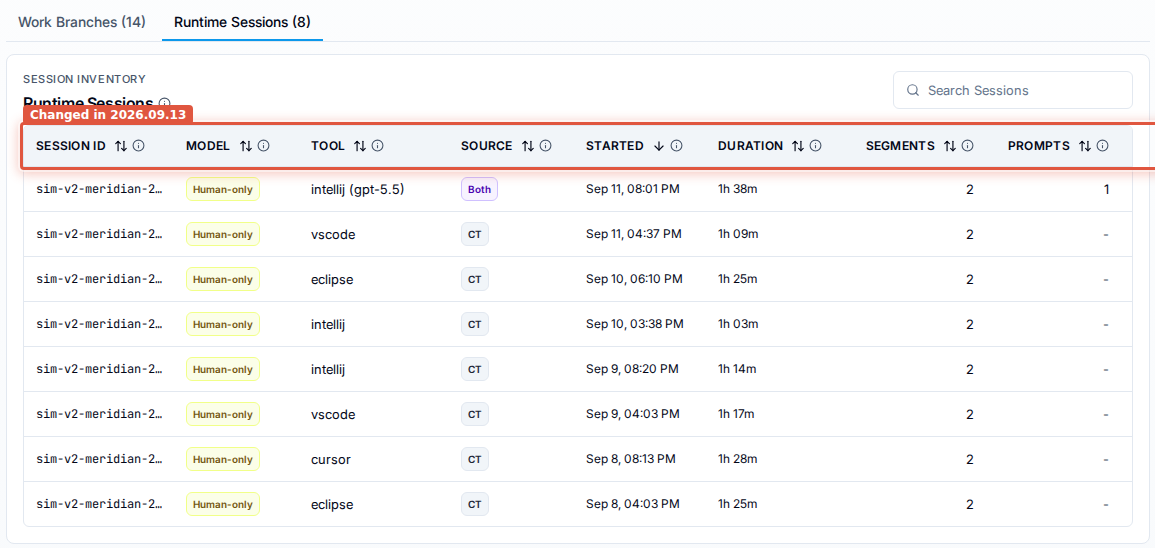
A Source column sits between Tool and Started, as a pill reading CT (an older
client, reporting before native reporting existed), Native OTEL (reported live by the AI
tool itself), Harvested (estimated afterwards from local usage data) or Both. The column
that read Work model is Model. Column widths are fixed rather than proportional, so
headers no longer clip to S... and the table scrolls sideways when the window is narrow;
long session IDs truncate with the full value on hover.
A work-branch header can name the committer's region
The footer line after the committer ends in region: <code> with the source in brackets -
(from timezone), (from locale fallback) or (explicit) - whenever a region has been
resolved for that committer. Nothing renders there when none has, which is normal. In the
same header, the Sessions row shows one pill per runtime session with captured activity
on the branch rather than one per contribution row, so duplicates are gone. The count beside
the label is every session on the branch while the pills show only the runtime-session page
loaded, and the row's info icon says exactly that.
Access and roles
The system role Owner is called Super Admin on-premises
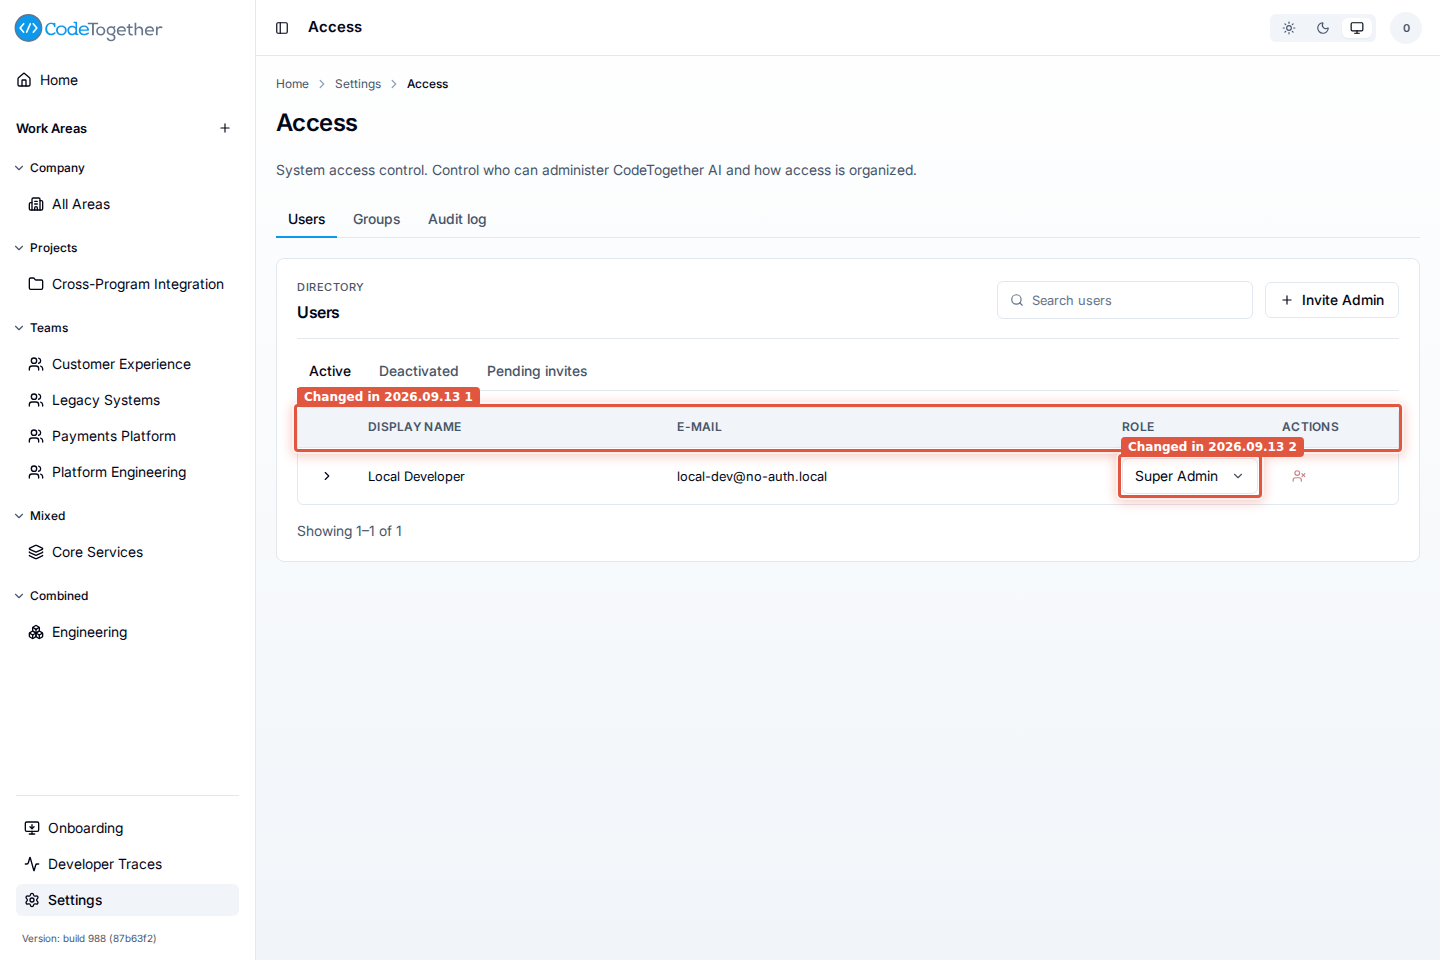
On-premises, everywhere the system-level Owner role is displayed or offered it reads Super Admin: the Role list on Settings > Access > Users, the conferred role on a group, and the audit log. SaaS still says Owner. The stored value is unchanged, so nothing you read through the API, an export or a support bundle moves. The work area role called Owner is a different role and did not change.
The same figure shows the Users table dropping two columns. Active users no longer carry a green Active pill in a Status column, because every row on that tab was one, and the Type column with its Human and Service pills is gone from both tabs. The over-limit No portal access pill moved next to the user's name. The Deactivated tab keeps its deactivation date.
Work area access is editable from a user or group row
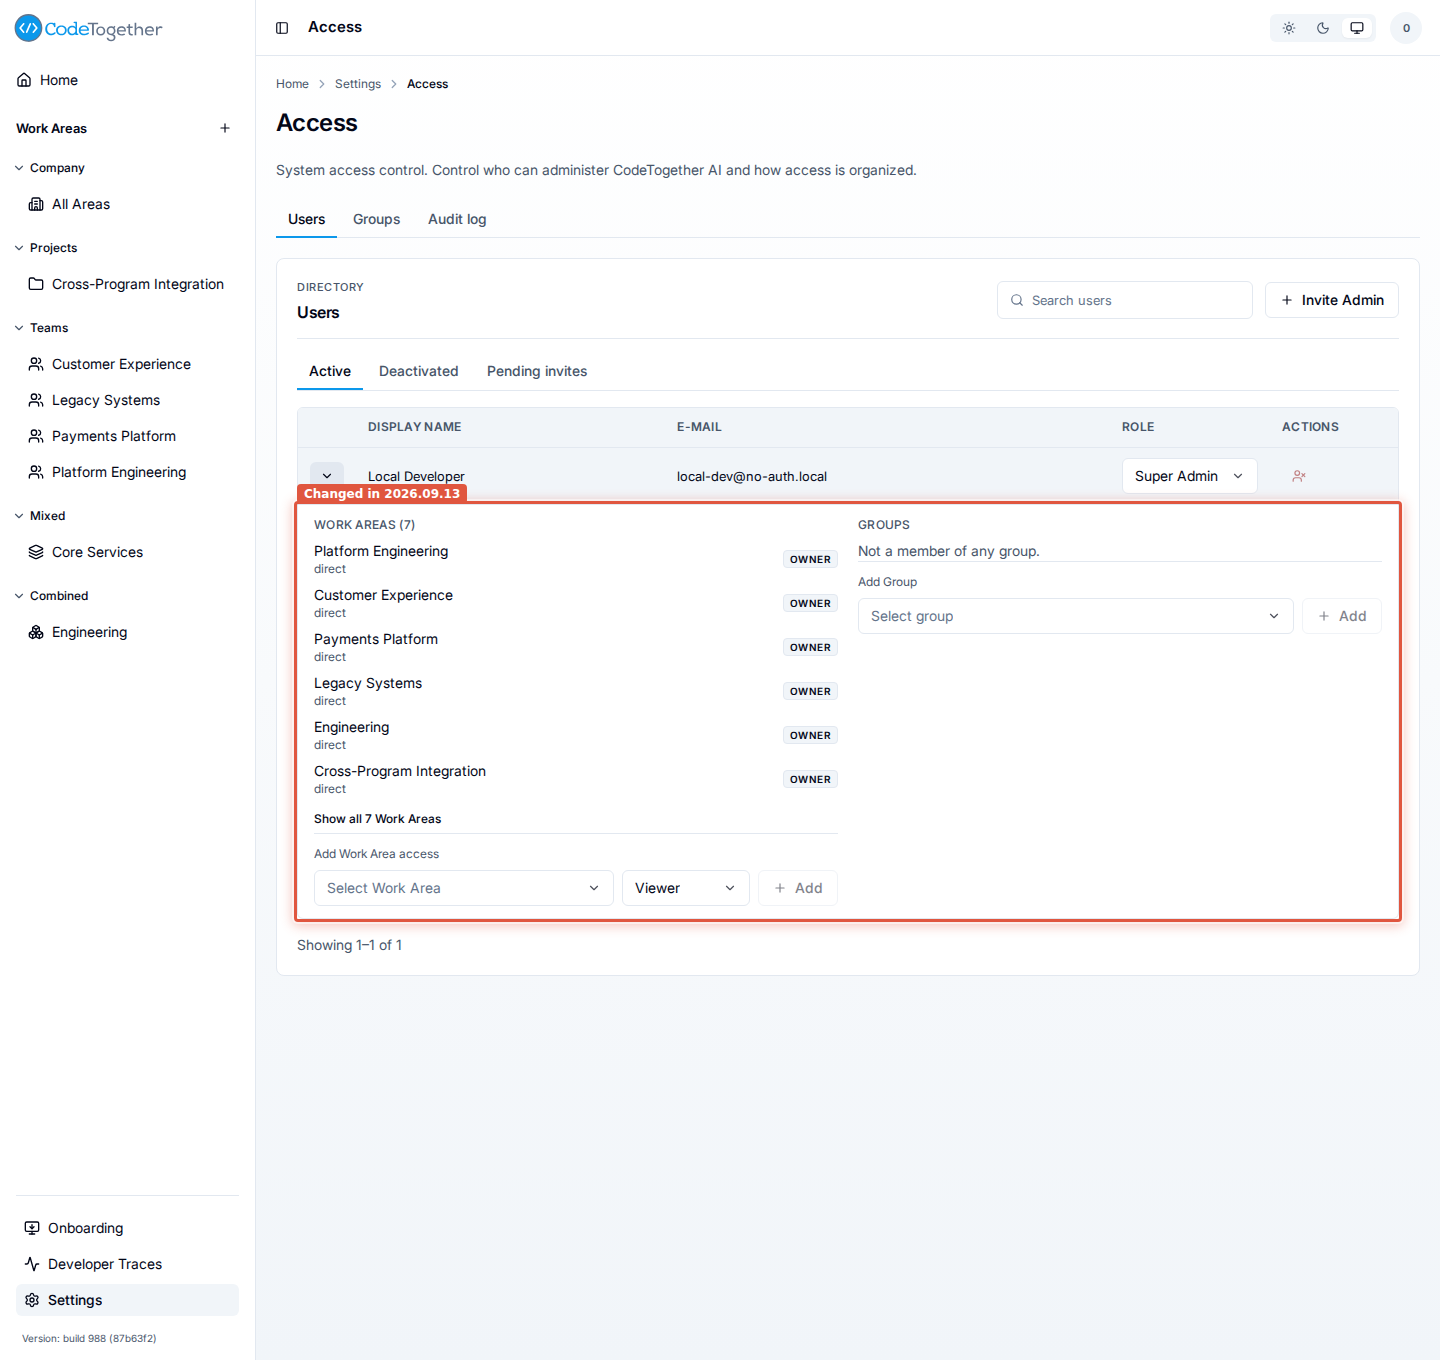
Expanding a user's row lists every work area they can reach. A grant made directly to them
reads direct and carries a role list you change in place; a grant inherited from a group
reads via, names the group, and is changed by editing the group. Add Work Area access
grants a new one, defaulting to Viewer. Long lists collapse behind Show all N Work
Areas and carry a filter box.
A group row on Settings > Access > Groups expands onto the identical control. Granting a group a work area role used to mean opening the work area; it can be done from either side, and the two views agree.
A member's work area role changes in place
In a work area's Manage access drawer, a member row carries a role list rather than
static text, so changing someone from Viewer to Admin no longer means revoking and
granting again. An Owner row stays read-only and points at Transfer ownership. The
role that read SelfOnly reads Self Only. The drawer's subtitle is "Members and roles
for this area." on every work area, including the company-wide one, where naming the area
read as though the grants spanned every work area.
The platform proposes identity merges
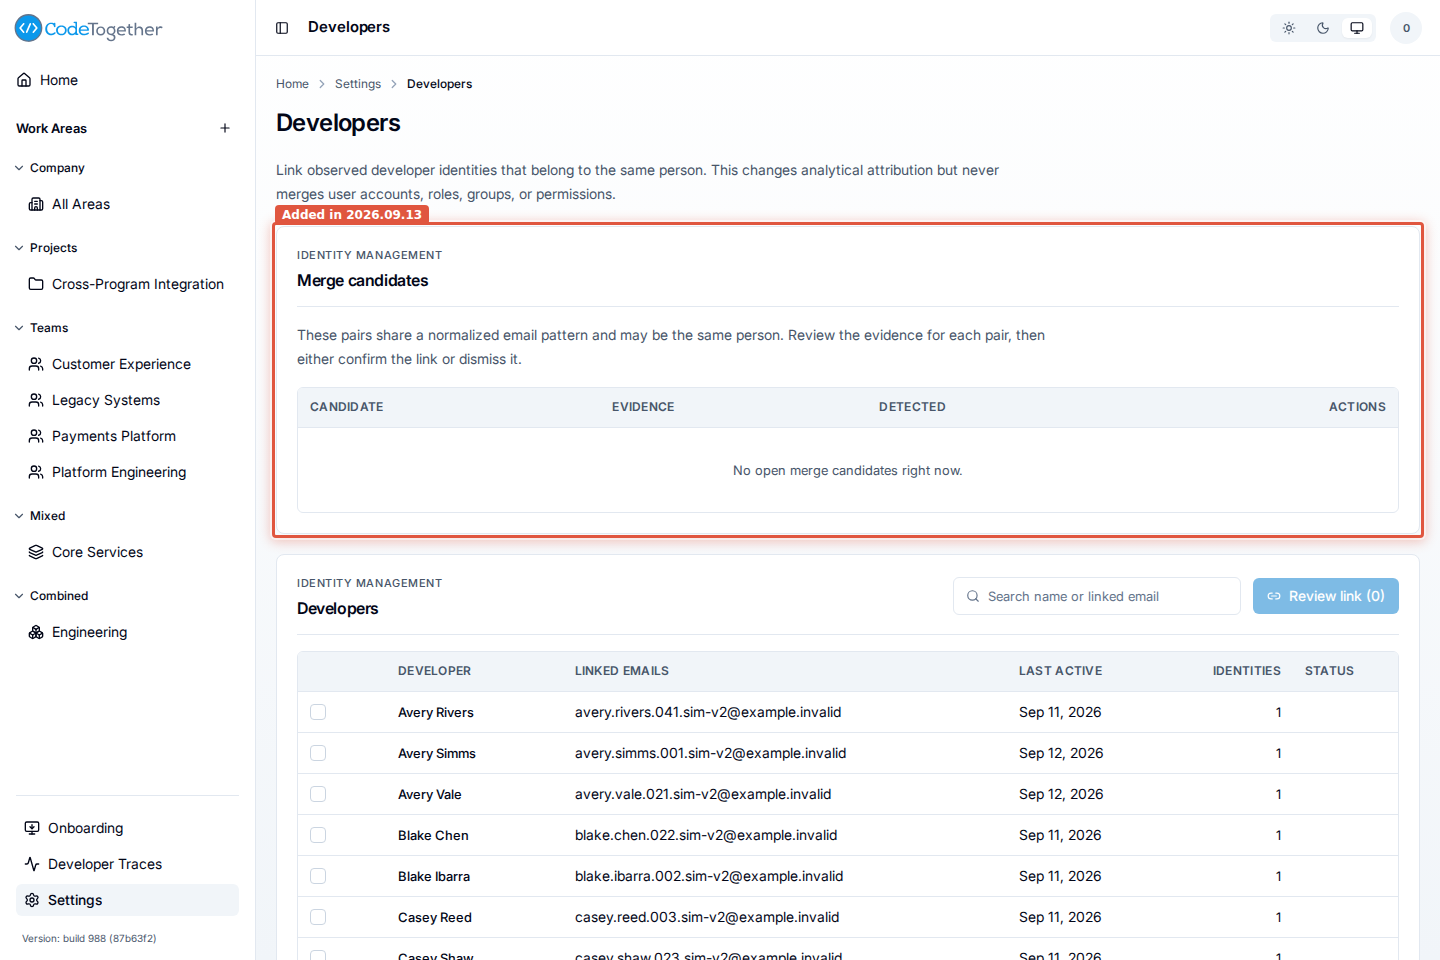
Settings > Developers gained a Merge candidates card that finds identity pairs sharing a normalized email pattern and proposes them, with the Evidence behind each pair and when it was Detected. Review link asks you to confirm before anything is linked, and Dismiss takes an optional reason. Nothing is linked automatically.
Invite, deactivate and reactivate copy
A work area invite says what acceptance grants: access to that work area, with the role on the invite. On-premises the form adds that accepting also redeems the person's other pending work area invites; SaaS spends one invite per accept and its form omits that clause. Deactivation says "They lose all access to the system." rather than listing groups separately. Reactivation warns that groups and work area access were removed at deactivation and must be granted again.
Tracking and workstation setup
Tracking answers whether a developer is reporting
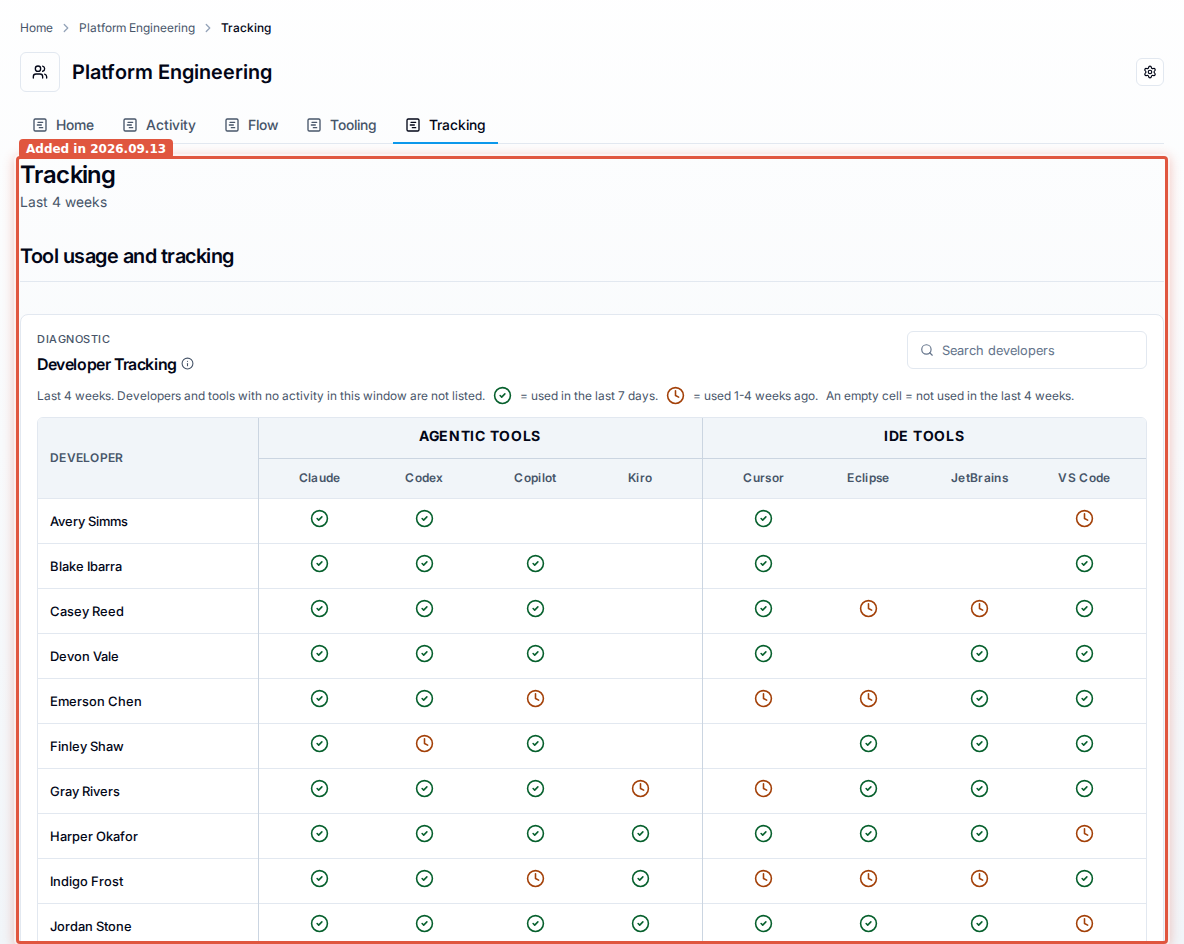
Every work area gained a Tracking tab: one row per developer, one column per tool, grouped under Agentic Tools and IDE Tools. A green check means the developer used that tool in the last 7 days, an amber clock means 1 to 4 weeks ago, and an empty cell means they did not use it in the last 4 weeks. Developers and tools with no activity in that window are left out of the roster entirely, so an absent name means nothing has reported rather than that someone was removed. The tab is visible to that work area's Owners and Admins.
This is the screen to open after onboarding a developer or activating a workstation, and it is what an administrator checks when a tracker goes quiet. Removing a tracker shows up on the Tracking tab as absence rather than as an event. The roster groups by developer and tool, not by machine, so removing tracking from one workstation changes nothing for a tool the developer still uses on another.
Tracker updates can be paused from the server
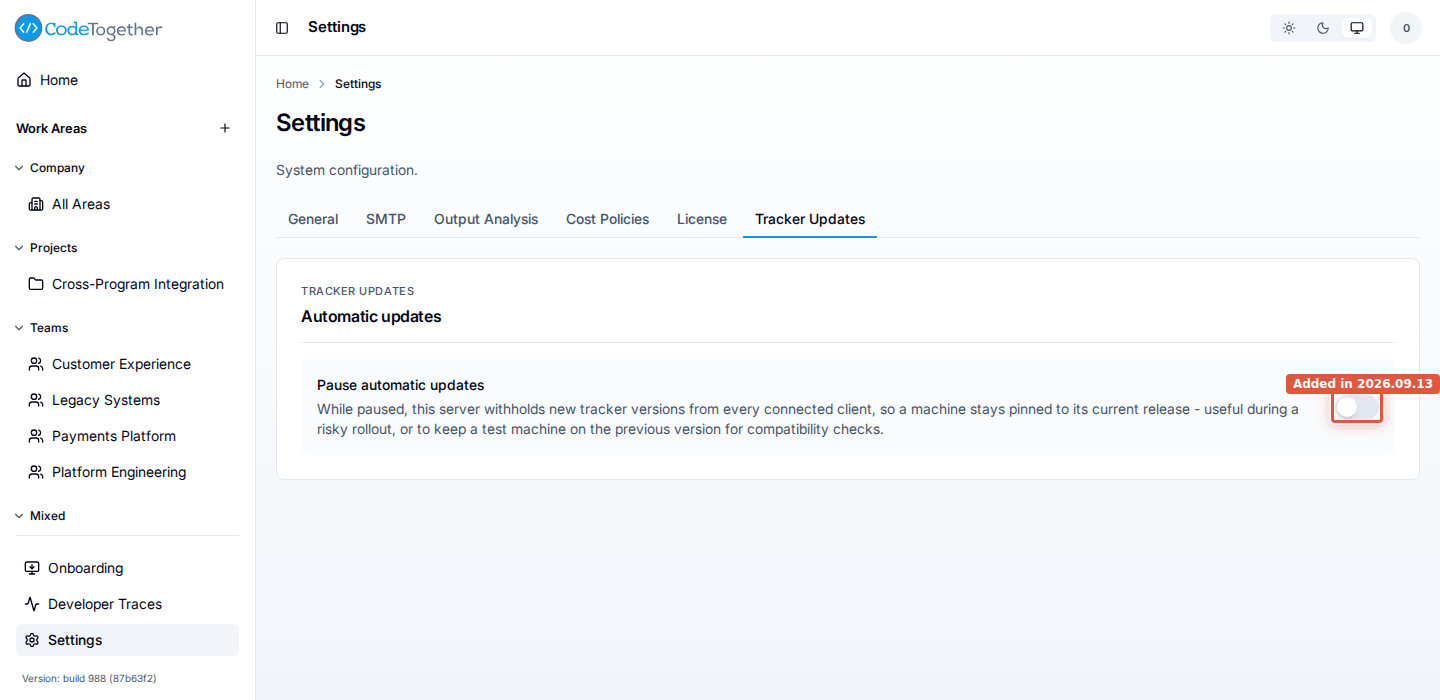
On-premises, Tracker Updates is a new tab at the end of the Settings > General tab strip, carrying an Automatic updates card with a single Pause automatic updates switch. While it is on, the server answers every polling client with "not modified", so a machine stays pinned to its current release. It is off by default, it applies to the whole tenant's fleet rather than one work area, and there is no SaaS equivalent. A paused server is also the reason a fleet stops converging on the current tracker version, which re-running setup does not fix. Turn the switch off to let the fleet update again.
Setup writes fewer files on a workstation
aitrax setup system stopped writing three things it used to write:
~/.codetogether/tracker/repos.json. Repository-level activation was retired from the tracker. That file is the registry of worktrees registered for daemon Git observation, and it is written when a worktree is registered. A workstation activated against an on-premises server that has completed setup and registered nothing hasaitrax,aitrax-full,aitrax-full.etagandaitrax.jsonin that directory and nothing else. On SaaS the directory also holdsbox-install.json.- The
[otel]table in~/.codex/config.toml. Codex activity is collected through the tracker; setup writes themcp_servers.aitraxentry and a tool pre-approval, and scrubs an[otel]table it wrote in an earlier release. kiroTelemetryConfig.endpointin Kiro'ssettings.json, for the same reason, and setup removes one it wrote previously.
Setup also deletes ~/.codetogether/tracker/mcp/, the legacy shim directory. Every
user-level registration points at the core binary ~/.codetogether/tracker/aitrax directly.
Settings, integrations and maintenance
Cost Policies holds a work schedule and nothing else
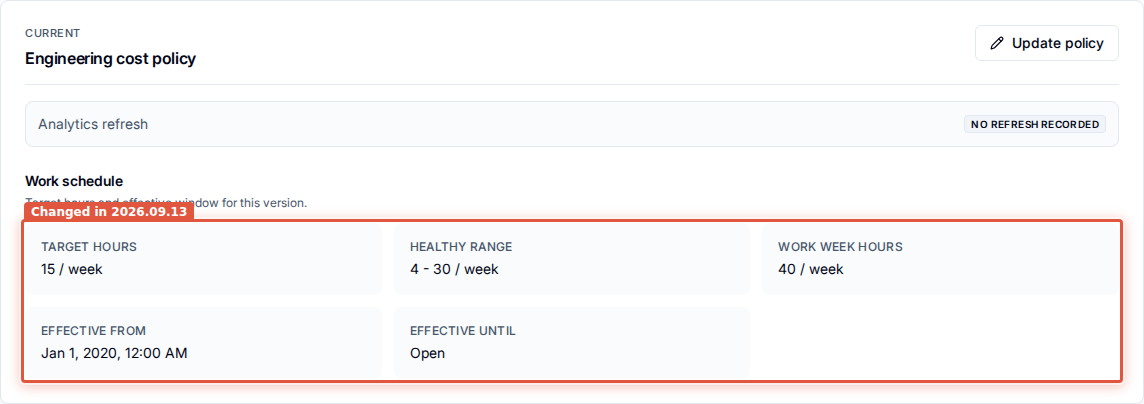
A cost policy version records a work schedule and nothing else: Work week hours, Target active hours / week, and a healthy band given by Healthy lower hours / week and Healthy upper hours / week, over the dates the version is effective. The current policy card reads those back as Target hours, Healthy range, Work week hours, Effective from and Effective until.
The Loaded cost, Efficiency and capacity and Regional annual loaded costs sections were removed, along with the currency badge and the policy name, flat annual fallback, hourly fallback, engineering ratio, regional catalog and origin rows of the version snapshot. A policy version no longer carries a salary assumption.
Recalculations can continue past the commit limit
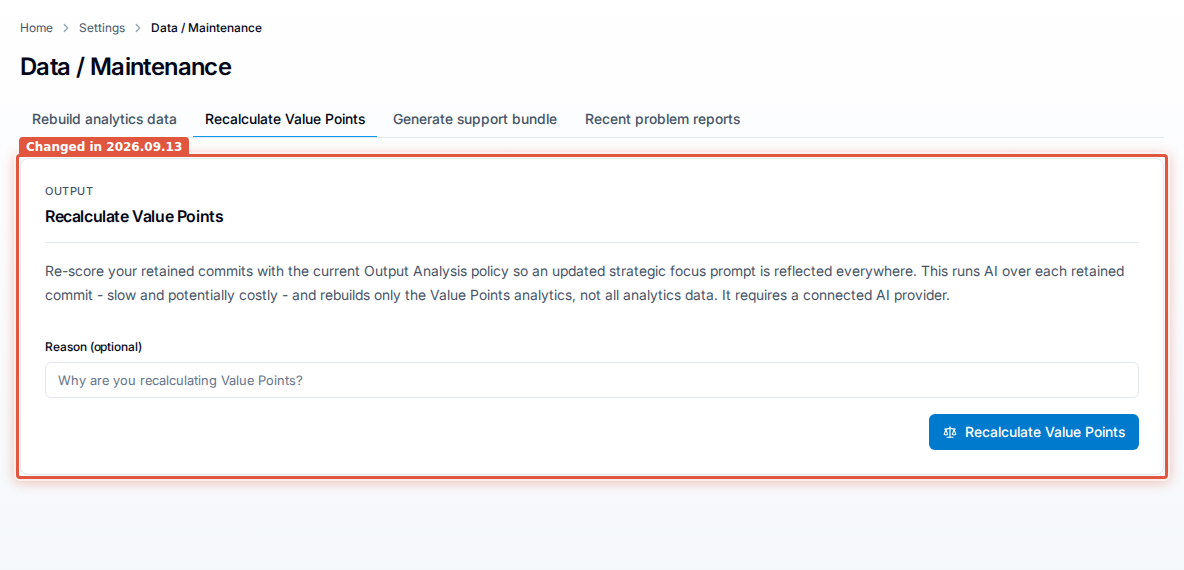
A recalculation started from the Recalculate Value Points panel covers a bounded number of the newest retained commits. A run that hits that limit finishes with a warning that the oldest commits were left out, and offers Continue with the remaining N commits instead of asking you to raise a limit and start again. A run with commits that could not be scored offers Retry N commits, and Run a full recalculation when a retry cannot cover them all. Until content analysis is active, the same panel reads Recalculate Output Points.
A Recent problem reports tab under Data / Maintenance
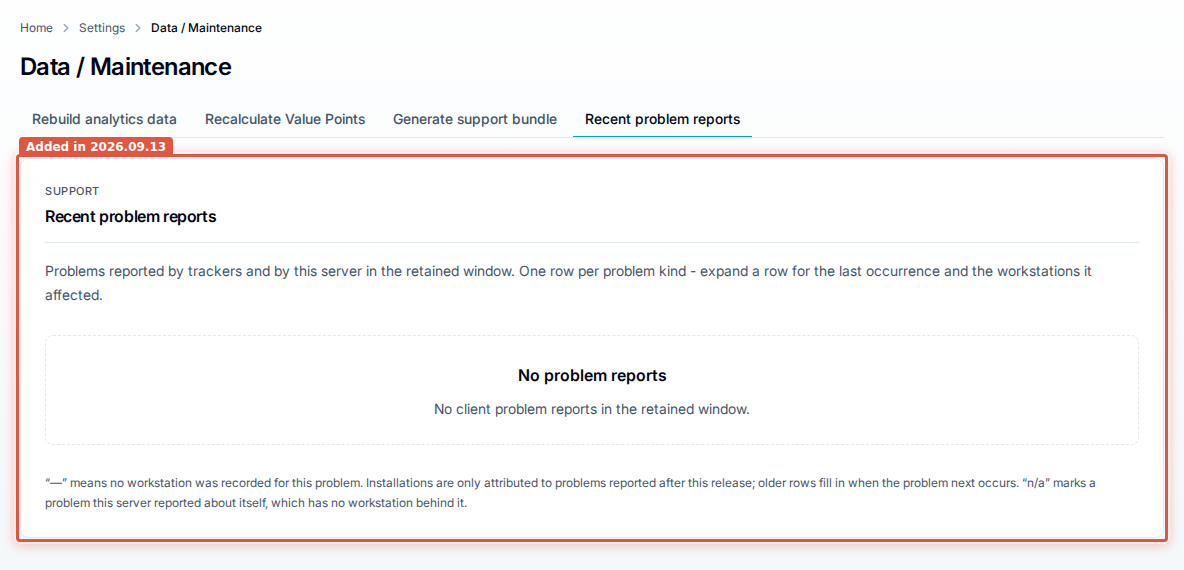
Recent problem reports is a new fourth tab on Settings > Data / Maintenance, after Generate support bundle. It lists the problems that trackers and the server itself reported in the retained window, one row per kind of problem, with its Severity, Problem, Source, Activity, Installs, Count and Last seen; expand a row for its last occurrence and the workstations it affected. The tab is on-premises only and is shown to anyone who can generate a support bundle, which is Owners and Admins.
A failed analytics rebuild says so in the navigation
While the current maintenance phase is failed, on-premises deployments show an Analytics rebuild failed link in the left navigation, in danger colour, to anyone who holds the capability that gates the retry. It opens Settings > Data / Maintenance, where Retry analytics rebuild sits on the rebuild status banner, and it clears itself when the failure clears. A failed rebuild used to be visible only to someone who had already opened that page, so a deployment could serve stale dashboards indefinitely.
While a rebuild is running, every dashboard page carries a notice for readers: "We are refreshing your data. Some numbers may be incomplete until this finishes." Creating a cost policy version enqueues one of those rebuilds.
The Rebuild analytics data panel on the same page says what it does more precisely: it rebuilds from activity already processed and does not replay the original tracking events. The rebuild status banner reports a first phase, Phase 1 of 3: Preparing historical activity, and a failure in it is titled Historical activity preparation failed.
The repository picker waits for a search
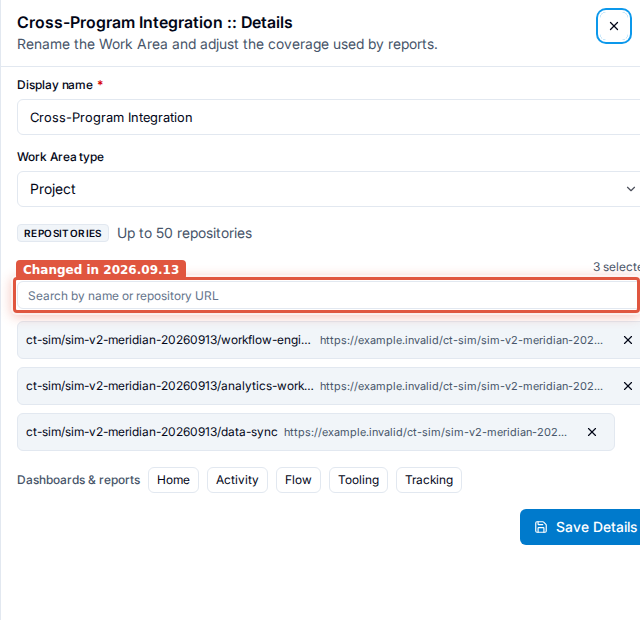
In the Create work area modal and the Work Area settings drawer, the repository results panel stays out of the layout until you type into Search by name or repository URL. The prompt "Type to search repositories." is gone with the empty box it sat in; "No repositories match the search." still reports a search that found nothing.
An older work area whose repositories were saved by a 64-character id rather than by name also shows each resolved repository name, with the remote URL beneath it.
An abandoned GitHub setup can be resumed on SaaS
The SaaS GitHub connection card gained a ninth status, Setup expired, whose description reads "GitHub setup expired before verification; resume setup to try again." Its repair button reads Resume setup, as it already did on a connection at Pending setup, so an installation that was started and abandoned is finished rather than repaired.
SaaS gains an organization switcher and drops Data / Maintenance
- An account in more than one organization gets an organization switcher in the sidebar header, listing each organization with its plan.
- SaaS Settings no longer carries Data / Maintenance. The recalculation path it held is on-premises only.
Behind the scenes: reliability and performance
Not every improvement in 2026.09.13 is something you click. This release also strengthens how the tracker on each developer's workstation keeps itself up to date, how work is captured across AI tools, and how quickly the server turns that activity into the numbers on your dashboards.
The tracker updates itself in place
- On Windows, tracker setup replaces the tracker even while it is running. Setup prepares the new version alongside the running one, puts it in place in a single step, and tries again while Windows still holds the file. If the replacement cannot finish, the setup output says the tracker on that workstation may be out of date, so an administrator knows which workstation to look at.
- The tracker's background program restarts when a new tracker version arrives, closes after eight hours with nothing to do, and starts again by itself the next time an AI tool or editor sends activity.
Capture follows each AI tool more closely
- GitHub Copilot activity in VS Code, JetBrains IDEs, Visual Studio and the Copilot command line is tied to the repository and the editor it came from. Each Copilot chat in VS Code is one session, and work that the Copilot command line hands to a helper agent appears as its own session with its own usage.
- The tracker reads Codex CLI 0.147 and later, including work Codex hands to helper agents, follows each Cursor composer on its own, and reads the Kiro IDE from the files it writes.
- Sessions the tracker reconstructs from a tool's saved history appear in session lists alongside sessions the tool reported as they happened.
- The Last seen column on the Active Developers roster draws on Claude Code and Codex activity as well as editor activity.
- An AI agent's session lasts as long as the agent is working, including stretches when the developer steps away.
Large volumes of activity are processed faster
- The server handles incoming activity in larger batches, so a backlog that builds up while workstations are offline is worked through faster.
- Background catch-up work runs a portion at a time alongside live activity and looks again only at what has changed, so dashboards keep updating while it runs.
Analytics rebuilds pick up where they stopped
- A rebuild of historical analytics saves its progress as it goes, and an interrupted rebuild resumes from its last saved point. On-premises, the rebuild status shows when that point was saved.
- The rebuild step behind coding time reads only the dates it is rebuilding, which keeps a full-history rebuild short.
Each developer's work comes together under one identity
- A developer's email address is recognized in one standard form wherever it appears: activity, commits and Copilot sessions.
- A commit counts toward the figures when its author matches a known developer. A commit whose author's email matches no developer is recorded as a problem report for an administrator to review; on-premises, these appear under Recent problem reports.
- The cost, coding time and AI share shown for each change combine every recorded session behind that change, and an estimated cost or a partly attributed change is labeled as such.
- The tracker records which folders and repositories each stretch of work touched, which is what the Activity tab's code areas are built from.
Uploads retry on their own, and email carries the CodeTogether brand
- Uploads that measure AI's share of each commit retry automatically in the background, spacing out their attempts, alongside activity reporting.
- Email sent by the server carries CodeTogether branding.