AI adoption report
The AI adoption report is the platform's executive report. It answers how agentic AI adoption is affecting delivery, and whether output per dollar is rising. It runs at the company level, on the system-wide All Areas scope.
- Deployment: SaaS, On-premises
The report carries the same date control as the dashboards. It defaults to Last 4 weeks, the last four complete Monday to Sunday weeks, so an in-progress week never moves the headline. The date control and Download detach into a pinned band when you scroll past them, so the period you are reading stays visible. For the metrics behind each figure, see the Metrics glossary.
What the report covers
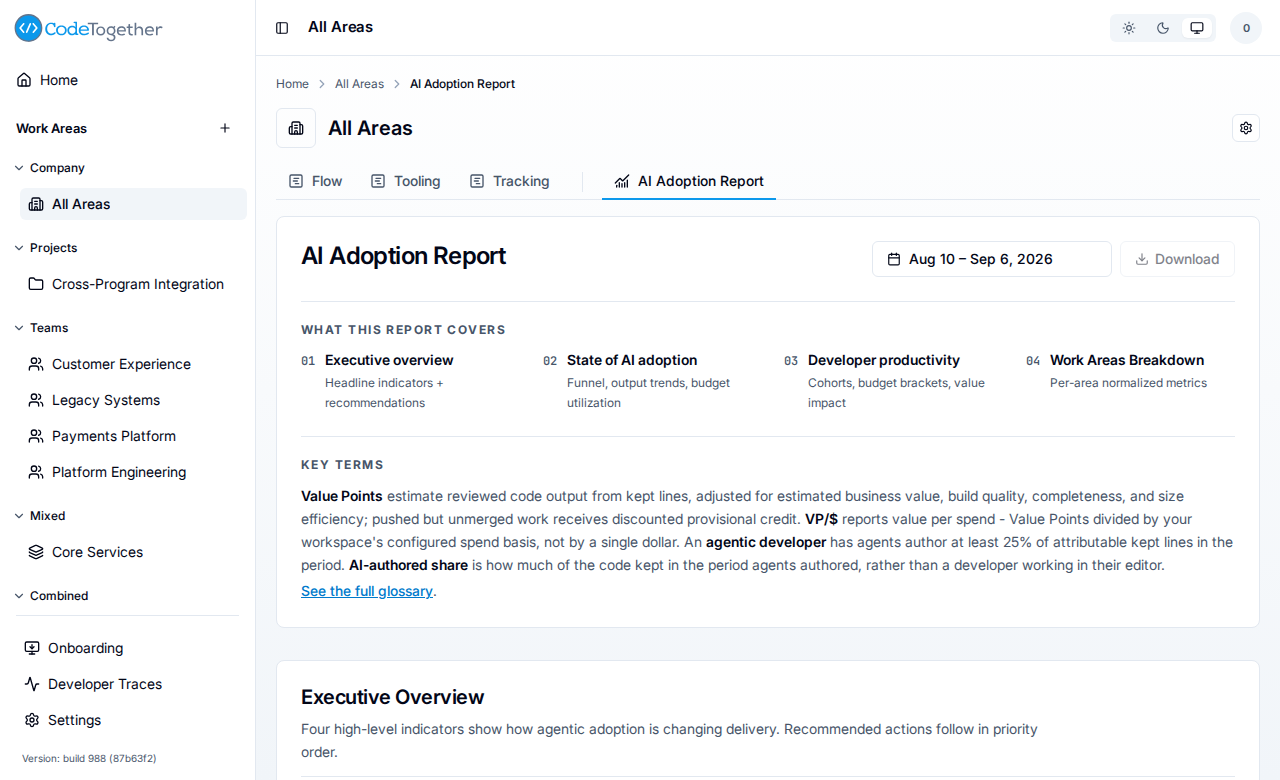
The report is organized into sections, from summary to detail. The What this report covers strip links to each one, under a shortened name (State of AI adoption for the section headed State of AI Engineering Adoption, Developer productivity for Developer Productivity & AI Acceleration):
- Executive Overview: four headline indicators.
- State of AI Engineering Adoption: how deeply AI is adopted, how output is trending by work model, and whether value per spend is climbing.
- Developer Productivity & AI Acceleration: developers banded by value output, by AI budget bracket, and by work model.
- Work Areas Breakdown: the same read split across work areas, with each area's type and team size.
- Definitions & glossary: the report's own terms, reached from See the full glossary in the Key terms block.
The four headline indicators
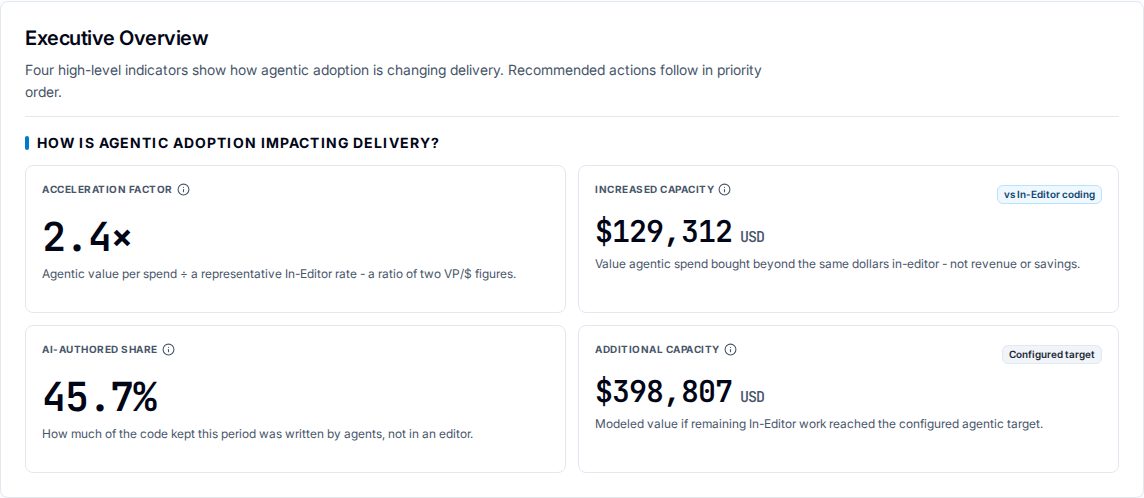
The Executive Overview opens with four indicators:
- Acceleration Factor: agentic value per spend divided by a representative in-editor rate, a ratio of two VP/$ figures.
- Increased Capacity: the value agentic spend bought beyond the same dollars spent in-editor, against the comparison basis named on the tile. It is a signed difference, so a period that ran below the comparison reads as a negative amount rather than zero.
- AI-Authored Share: how much of the code kept in the period agents authored, rather than a developer working in their editor. It carries no target, because it describes composition rather than a goal.
- Additional Capacity: the modeled value if the remaining in-editor work reached the configured agentic target.
Money on this report reads as whole currency units with the ISO code, such as $129,312 USD.
Who is using AI, and how deeply
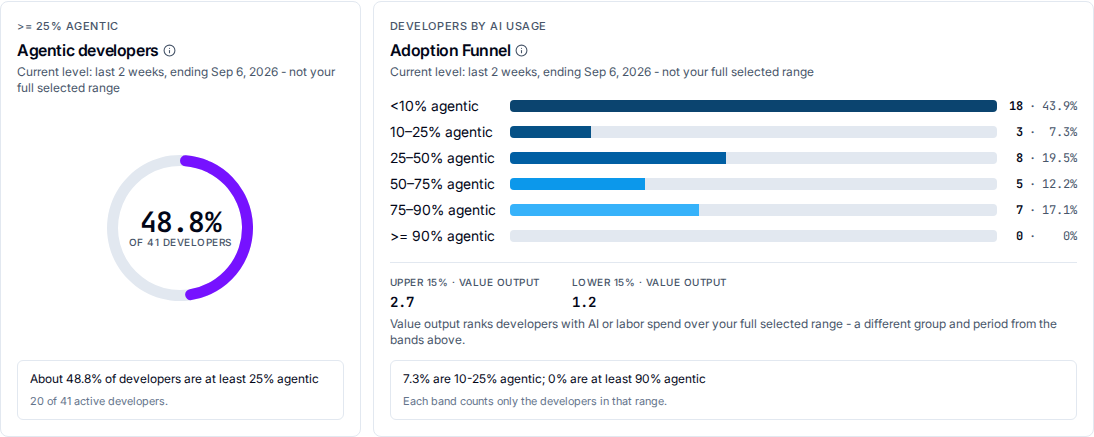
An agentic developer is one who has agents author at least 25% of their attributable kept lines in the period. The Agentic developers gauge reports what share of your active developers clear that bar, over the same active-developer count the Flow tab shows. Developers who were active but shipped no retained output stay in the denominator, because they did not reach the tier.
The Adoption Funnel groups the active developers who have retained output into six bands that count each developer once: under 10% agentic, 10-25%, 25-50%, 50-75%, 75-90%, and 90% or more. Each band reads its developer count and its share, and the bars are scaled against the largest band. Active developers with no retained output appear in no band, so the bands can total fewer developers than the count beside the gauge.
Under the funnel, two Value output figures labeled Upper 15% and Lower 15% preview the cohort table from the Developer Productivity section. They rank developers with AI or labor spend over your full selected range, a different group and period from the bands they sit under.
The gauge and the funnel read a shorter headline window than the range you selected, and each states the window it used above its figures. The trend charts in the same section shade that window and label the shading.
Every panel in the report states the window and the population it counted in its footer, including how many developers were left out and why.
Developers banded by what they return
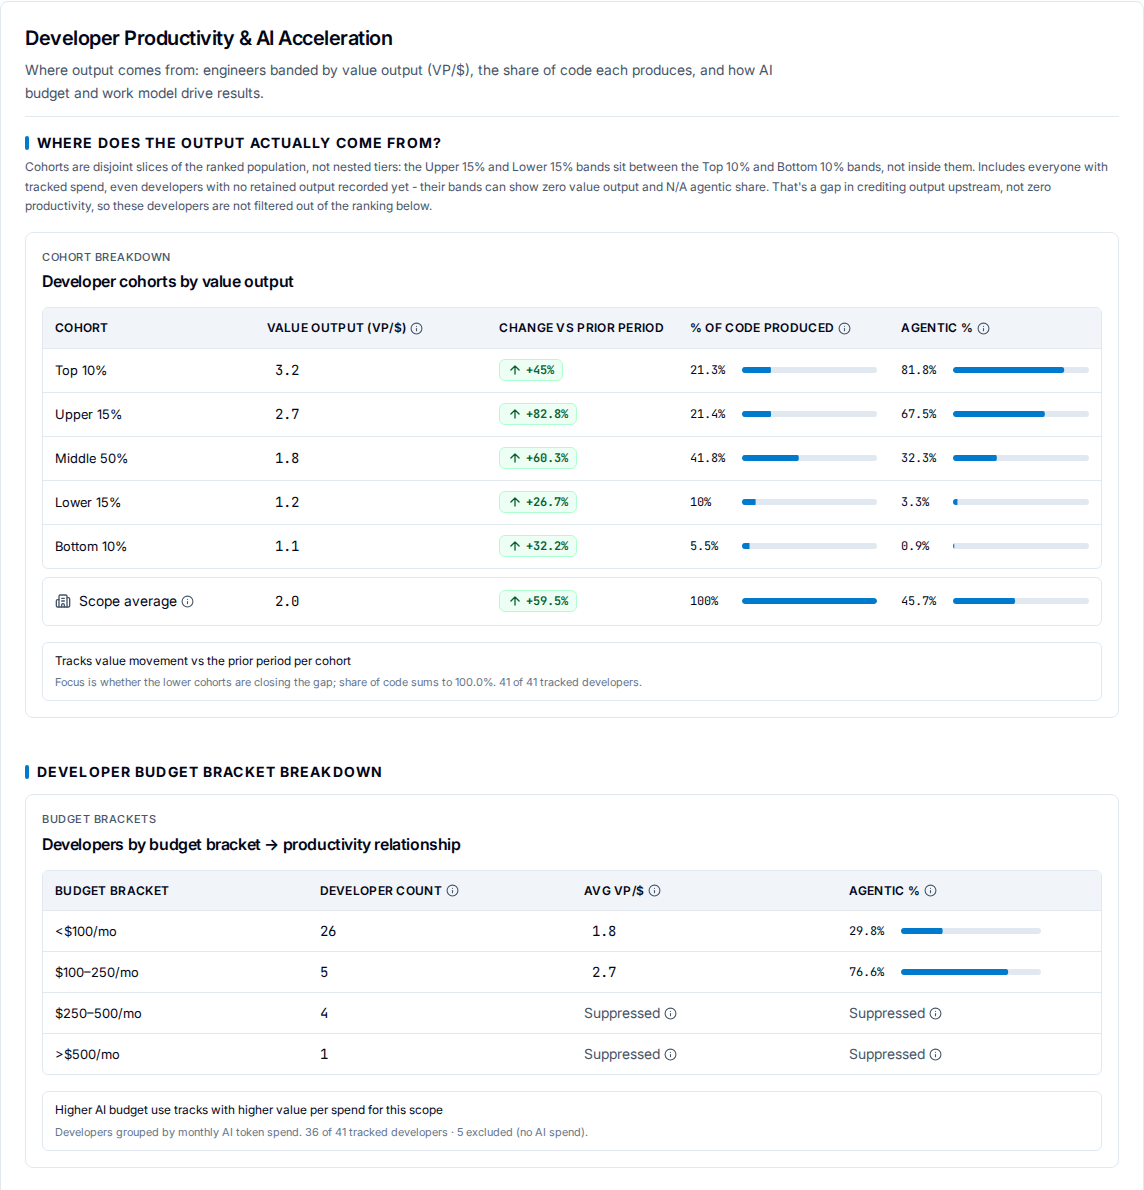
The cohort table bands the ranked population into Top 10%, Upper 15%, Middle 50%, Lower 15%, and Bottom 10%, with a Scope average row beneath them. The bands are disjoint slices rather than nested tiers: Upper 15% and Lower 15% sit between the Top 10% and Bottom 10% bands, not inside them.
Two more panels follow. Developer budget bracket breakdown groups developers by monthly AI token spend and reports each bracket's developer count, average VP/$, and agentic share.
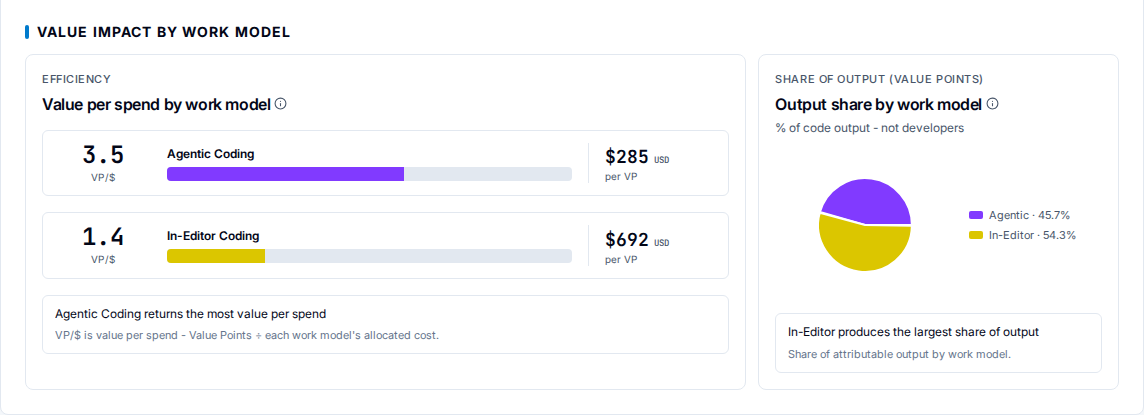
A Value impact by work model panel closes the section. It reports each work model's value per spend and its cost per value point, and charts each model's share of total output by value points rather than by developer count.
Work areas side by side
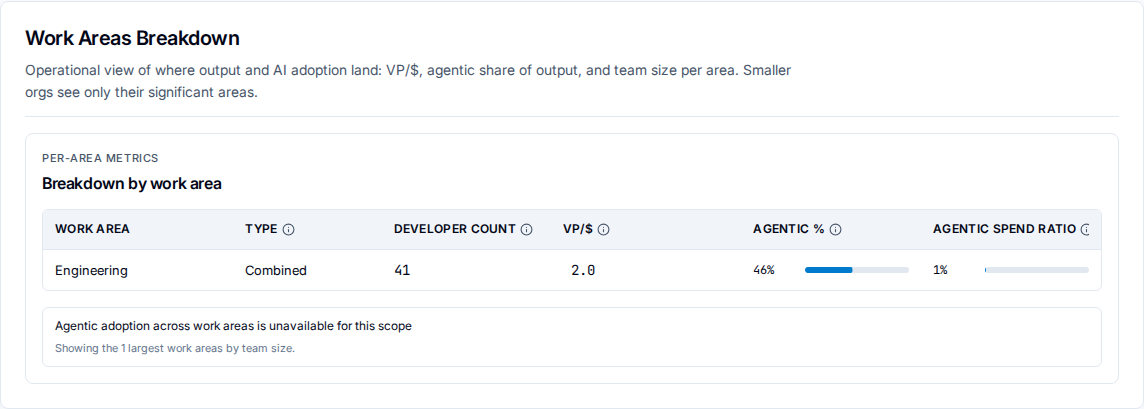
The breakdown table reads work area, type, developer count, VP/$, agentic share of output, and agentic spend ratio. The Type column names how the area is scoped — Project, Team, Mixed, or Combined — using the same vocabulary as Work area templates.
Each panel's takeaway line is derived from the data in front of you, so it reports a flat or unavailable result as readily as a rising one.
Output per dollar is the spine of the report
The report is built around value per spend (VP/$): value points divided by your configured spend basis, which is the allocated engineering and AI cost for the scope. It compares your observed rate against an industry baseline and reports an acceleration factor: agentic work's VP/$ divided by a representative in-editor rate. Both terms are defined in the metrics glossary.
Because the report reads output against cost, both halves have to be trustworthy. See Value points and Set capacity assumptions.
Every VP/$-derived figure on this report, including the acceleration factor, the cohort table, and the value-per-spend panel, follows the metrics glossary's zero-versus-blank convention: a figure reads as unavailable until value points exist for the period, since it has nothing to divide by cost. Where AI analysis is unavailable, these same figures report output points instead, labeled OP/$.
Where it is available
The report renders only on the company-wide All Areas scope, not on an individual Team, Project, Mixed, or Combined work area — the platform's scoped reporting views, described in Dashboards. Those work areas carry the Home, Activity, Flow, Tooling, and Tracking tabs instead.
Related
- Value points — the output measure the report divides by cost.
- Set capacity assumptions — the capacity side of output per dollar.
- Dashboards — the per-work-area surfaces alongside this report.
- Metrics glossary — the report's metrics defined.