Dashboards
The portal has one role-aware overview, Home, and a set of tabs that each read a work area over a period: Home for a summary, Activity for where work happened, Flow for delivery, Tooling for AI tool usage, and Tracking for who is capturing. This page explains what each shows and who sees what. For exact metric definitions, see the Metrics glossary.
- Deployment: SaaS, On-premises
Every dashboard reads a single work area for a chosen period. What you see is shaped by your role and your work area membership. See Roles reference.
Every screenshot on this page shows a sample dataset, so the work area names, repository names, developer names, and figures in them are generated rather than real.
Home reshapes itself to who you are
Home is a single overview page that shows a different set of tiles depending on who opens it. It picks exactly one of the following, from your role and the work areas you administer:
- System admins (Owner or Admin) see a comparison across their work areas, then System health, covering license, integrations, and data freshness.
- System admins who also administer work areas see an organization activity row and its leaderboards first, then the work-areas comparison, then System health. System health renders after the other sections rather than first.
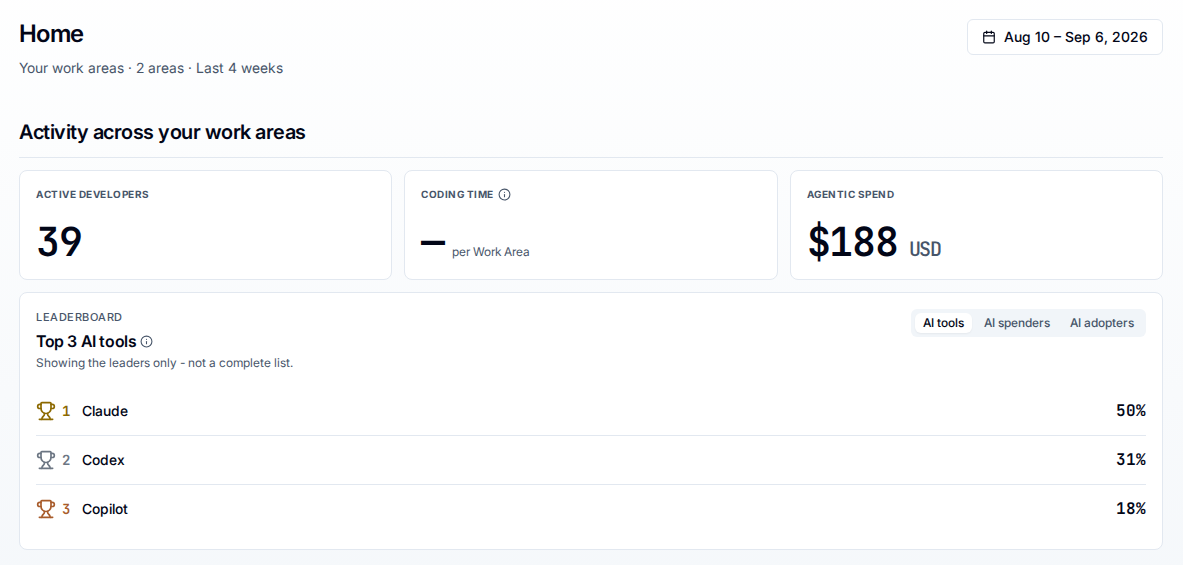
- Managers who own two or more work areas see Activity across your work areas: one summed KPI row covering every area they own, and a cross-area leaderboard with AI tools, AI spenders, and AI adopters tabs. Coding time does not add up across areas, so its tile shows a dash labeled per Work Area; open one of the areas to read its coding time.
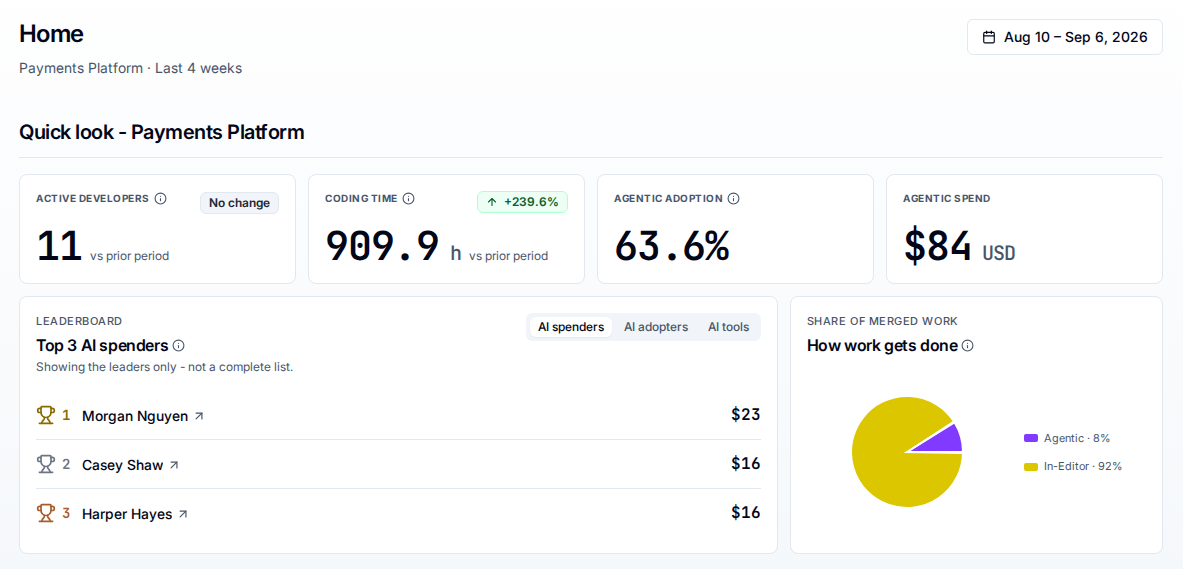
- Single-area admins see a Quick look at their one area: Active developers, Coding time, Agentic adoption, and Agentic spend tiles, a leaderboard that opens on AI spenders, and a How work gets done chart splitting merged work into Agentic and In-Editor.
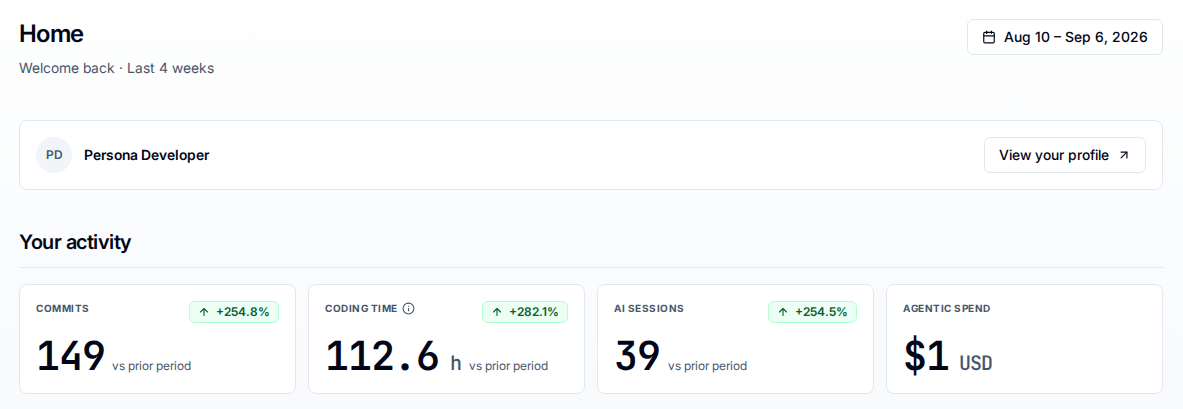
- Developers see Your activity: personal metrics for commits, coding time, AI sessions, and Agentic spend, their top tools, recent work branches, and a link to their full Developer profile.
The Your work areas section of Home, which is a different thing from the Work Areas list in the left nav, groups its rows under two tabs rather than one tab per work area type. Combined areas go under Combined; every other type, including Mixed and Company, goes under Projects & Teams. Both tabs appear only when both groups have rows; otherwise the section carries a count label such as Projects & Teams (5). Past 15 areas, Combined leads and opens first.
The connection tile is not tracker status
Home shows an Integrations tile counting connected integration categories, as a fraction such as 2/2 under the word connected. On-premises it counts your source-control connection and, where your plan includes it, your AI-analysis provider, so a deployment whose plan excludes AI providers reads 1/1 when everything it can connect is connected. On SaaS it counts source control alone and reads 0/1 or 1/1.
Whatever it reads, it says nothing about whether any tracker is installed or reporting. A healthy fleet can sit beside 1/2, and a full count is compatible with zero developers reporting. Never use this tile to verify tracker setup. To check capture, use the Tracking tab or Validate data with developer traces.
A work area opens on a strip of tabs
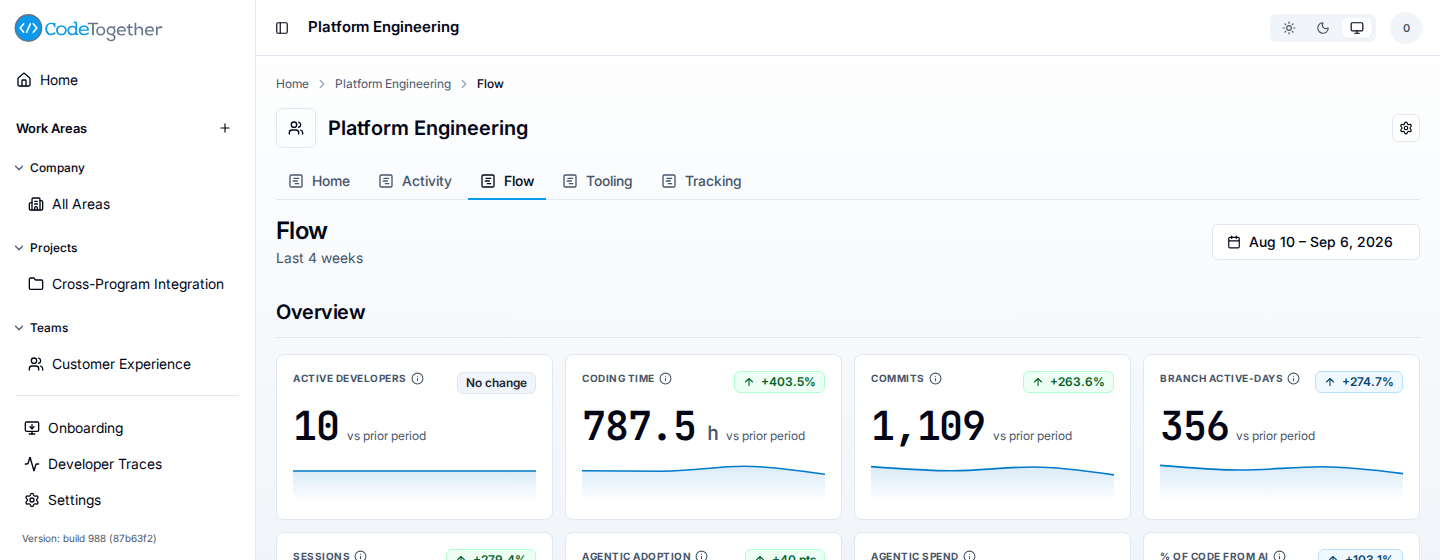
Selecting a work area in the left nav opens its tab strip under the work area name. The strip is Home, Activity, Flow, Tooling, Tracking.
The following table lists what each tab answers:
| Tab | Answers |
|---|---|
| Home | What happened in this area, in one screen |
| Activity | Which parts of the code the team worked in |
| Flow | What the team delivered and where work is stuck |
| Tooling | Which AI tools and editors the team uses |
| Tracking | Which developers and tools are reporting |
Tracking is a diagnostic surface for the work area's Owner or Admin. Anyone else does not see the tab at all.
The report pages share one date range: changing the period on Home, Activity, Flow, Tooling, or the AI adoption report carries it to all the others. The range defaults to the last four complete Monday-to-Sunday weeks and cannot be narrower than 14 days, so a shorter pick is widened and the page says so.
The dates themselves are on the range control at the top of the tab. The subtitle under the tab name describes the same range two ways: Flow, Tooling, and Tracking read Last 4 weeks, while Home and Activity read Last 28 days. Tracking has no range control of its own and always reports the last 4 weeks.
The Home tab summarizes a work area
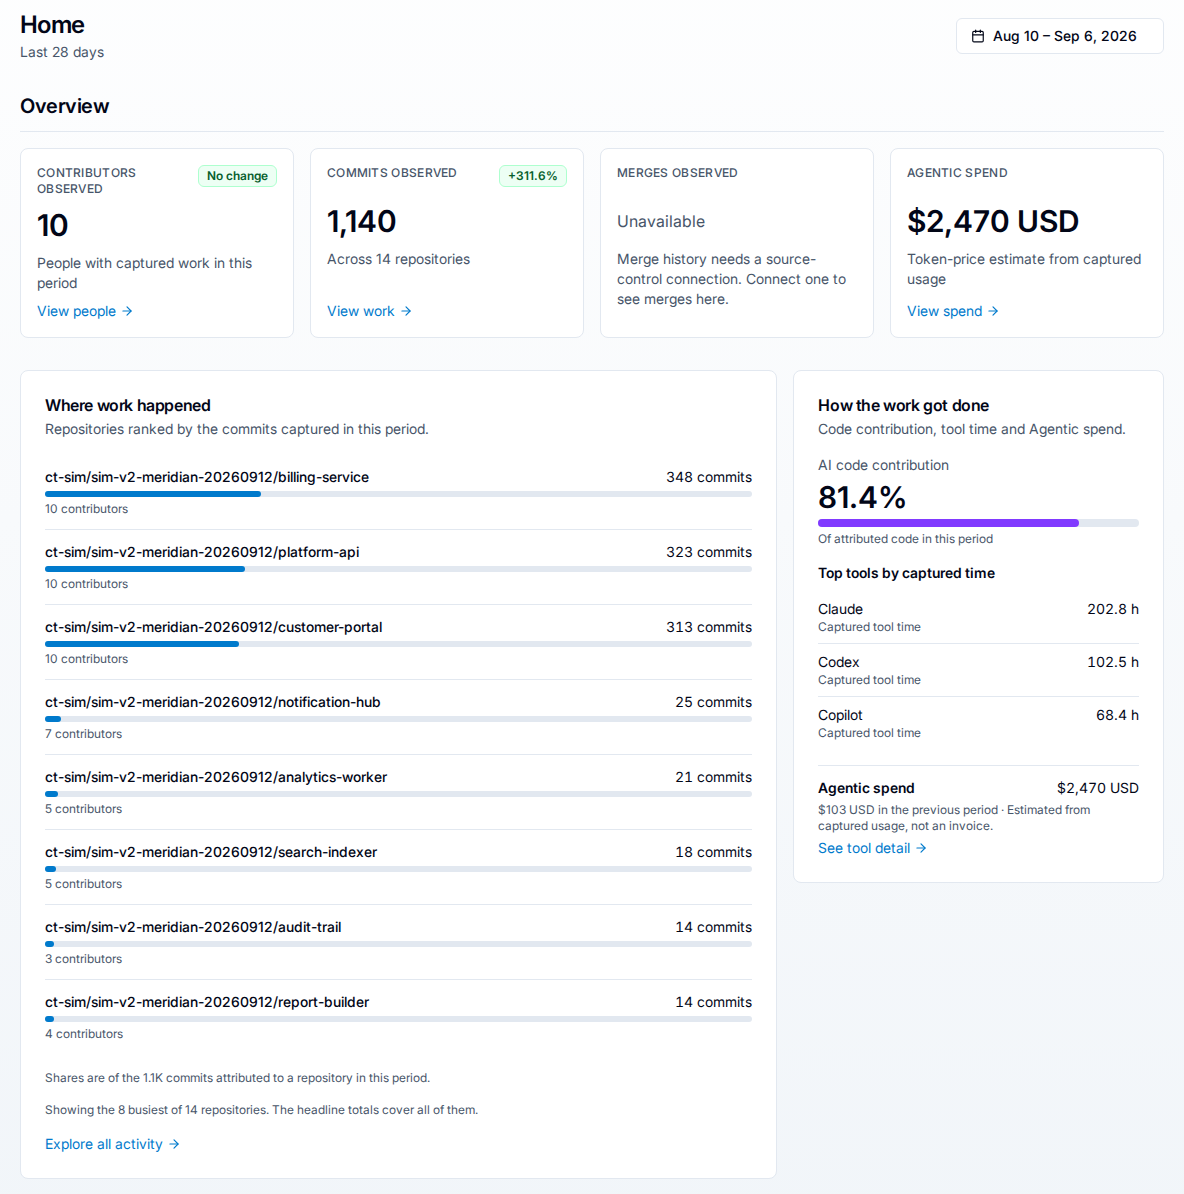
Home answers what happened in this area over the period, in one screen. It has these parts:
- Overview: Contributors observed, Commits observed, Merges observed, and Agentic spend. A tile with a measure carries a drill-in link that opens the tab explaining it, on the same period: View people opens the developer list, View work opens Activity, and View spend opens Tooling.
- Where work happened: the repositories in the area ranked by the commits captured in the period, with a contributor count under each. The panel lists only the busiest few and says how many of the area's repositories that is; the Overview totals still cover all of them.
- How the work got done: AI code contribution as a share of attributed code, the top tools by captured time, and the period's Agentic spend.
A tile whose measure cannot be served reads Unavailable, with the reason underneath and no drill-in link, rather than a zero. Merges observed reads that way on every work area checked, including work areas whose source control is connected. Its on-screen reason asks for a source-control connection, so treat the tile as unproven rather than as evidence that yours is broken: confirm the connection from Connect integrations, which reports its own status, and read the release notes for your build before raising it as a fault.
The Activity dashboard shows where work happened
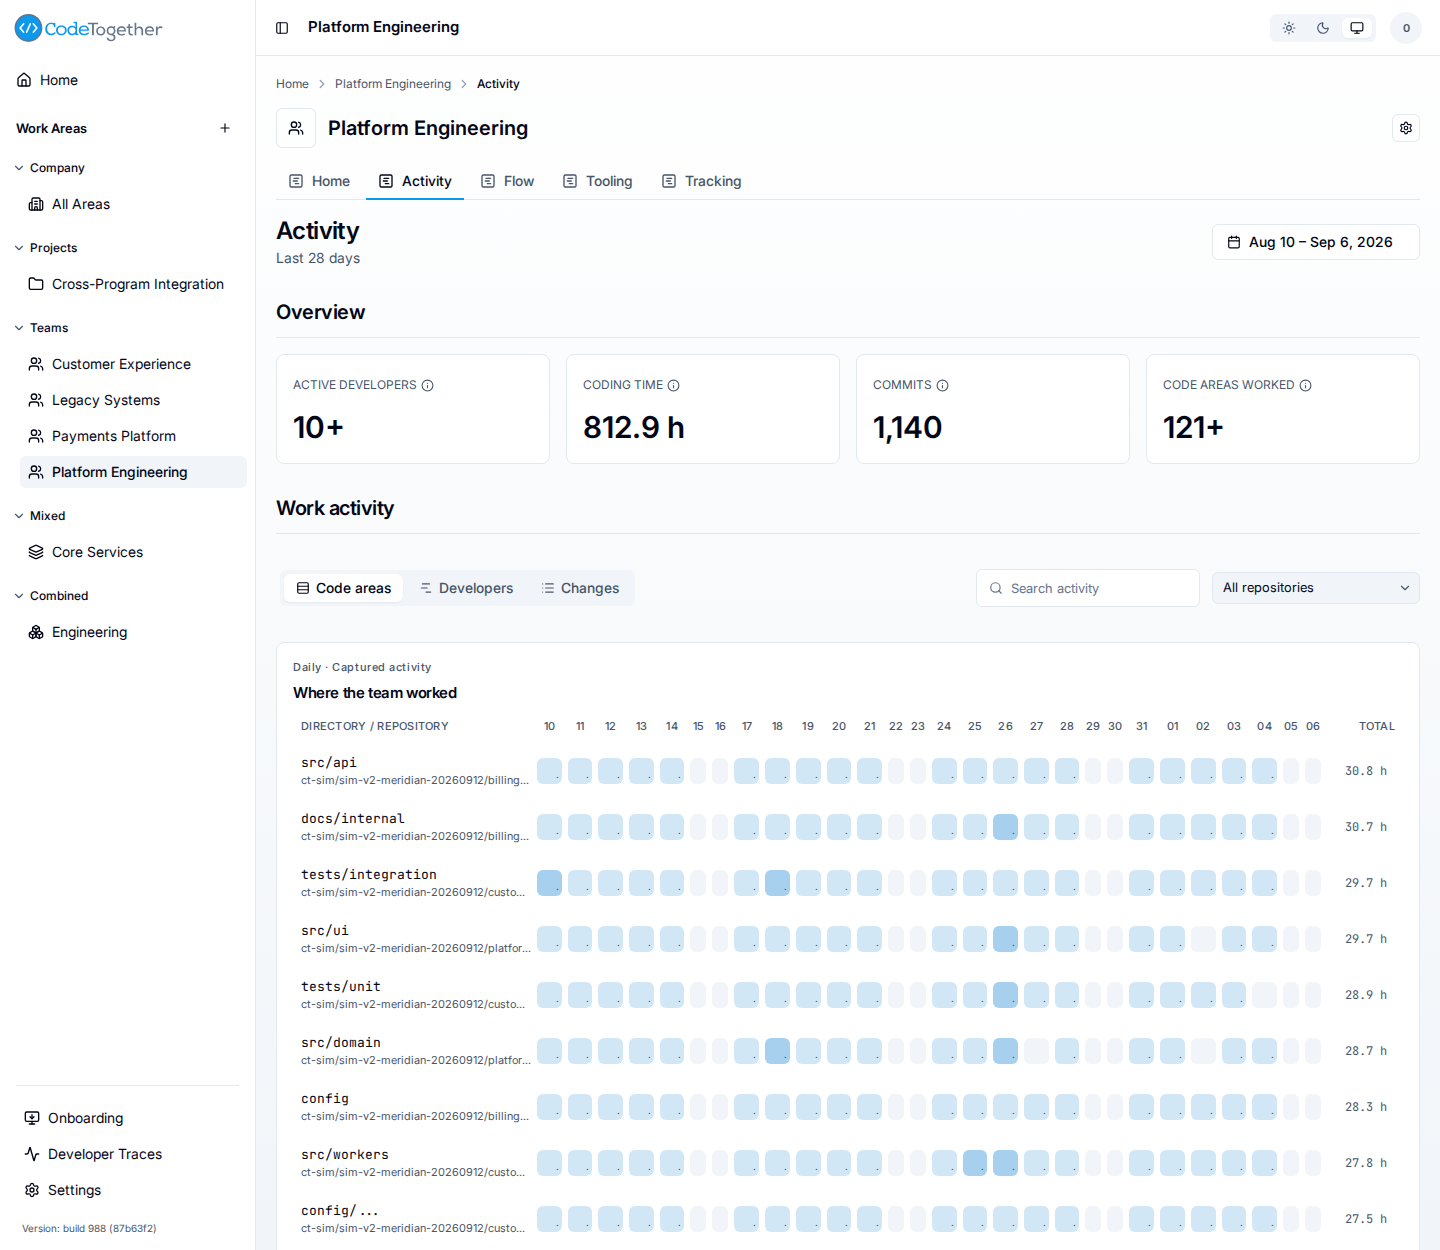
Activity answers which parts of the code the team worked in. It has these parts:
- Overview: active developers, coding time, commits, and code areas worked. Active developers and Code areas worked are counted from the rows the heat grid loaded, so a trailing plus, as in
10+, marks a count those rows do not fully cover; commits and coding time come from their own measures and carry no plus. On a work area scoped to repositories, the time tile reads Repository coding time and reports repository-day minutes, which is a different measure from Flow's Coding time: a block spent in two of the area's repositories counts in each. - Work activity: Where the team worked, a heat grid of directories against time, with one row per directory and repository and a total for the period. Columns are days for a range of 28 days or less and ISO weeks beyond that. Switch the view between Code areas, Developers, and Changes, narrow it with Search activity, and scope it to one repository with the All repositories filter.
Activity asks a per-area question, so the All Areas scope drops the tab while any work area exists: the company-wide grid would be the union of every area's directories. An account with no work areas of its own keeps the tab on All Areas.
The Flow dashboard shows delivery and work status
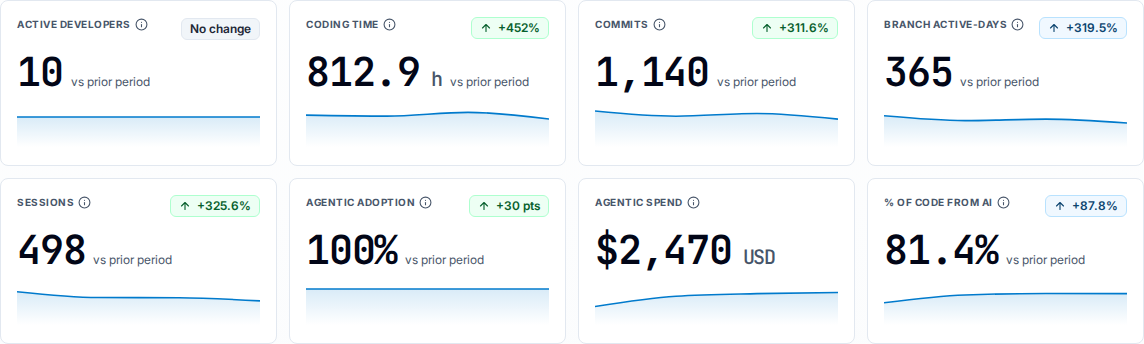
Flow answers what the team did and where work got stuck, for the selected period. It has these sections:
- Overview: eight KPI tiles. Active developers, coding time, commits, branch active-days, sessions, agentic adoption (agent, CLI, and MCP use, narrower than overall AI adoption), Agentic spend, and % of Code from AI.
- Trends: output over time in lines or commits, value-weighted output over time, the In-Editor versus agentic composition of that output, and value per spend (VP/$) over time.
- Activity patterns: a weekday-by-hour heatmap of when the team works. Times are stored in UTC and rendered in each viewer's own browser timezone.
- Work status: contribution mix by work model, and Review & merge flow with the completed work rate, commit-to-push lag, and the count awaiting review. A measure the deployment cannot serve states its reason rather than rendering an empty chart.
- Developer roster: a per-developer table of coding time, commits, value points delivered, and agentic code share. Selecting a name opens that person's Developer profile. On a combined work area, and on All Areas whenever other work areas exist and more than 20 developers are in scope, the roster lists work areas instead of people, and a row drills into that work area.
Not every tile carries a comparison badge, and the Activity tiles carry none at all. Where a tile does compare against the prior period, a share such as agentic adoption reports the movement in percentage points (+30 pts) and every other tile reports a relative change (+14.7%). Where the two periods match, the badge reads No change, and where there is no prior period to compare against, no badge appears. % of Code from AI reports a relative change rather than points, unlike the other shares.
The Tooling dashboard shows which AI tools are used
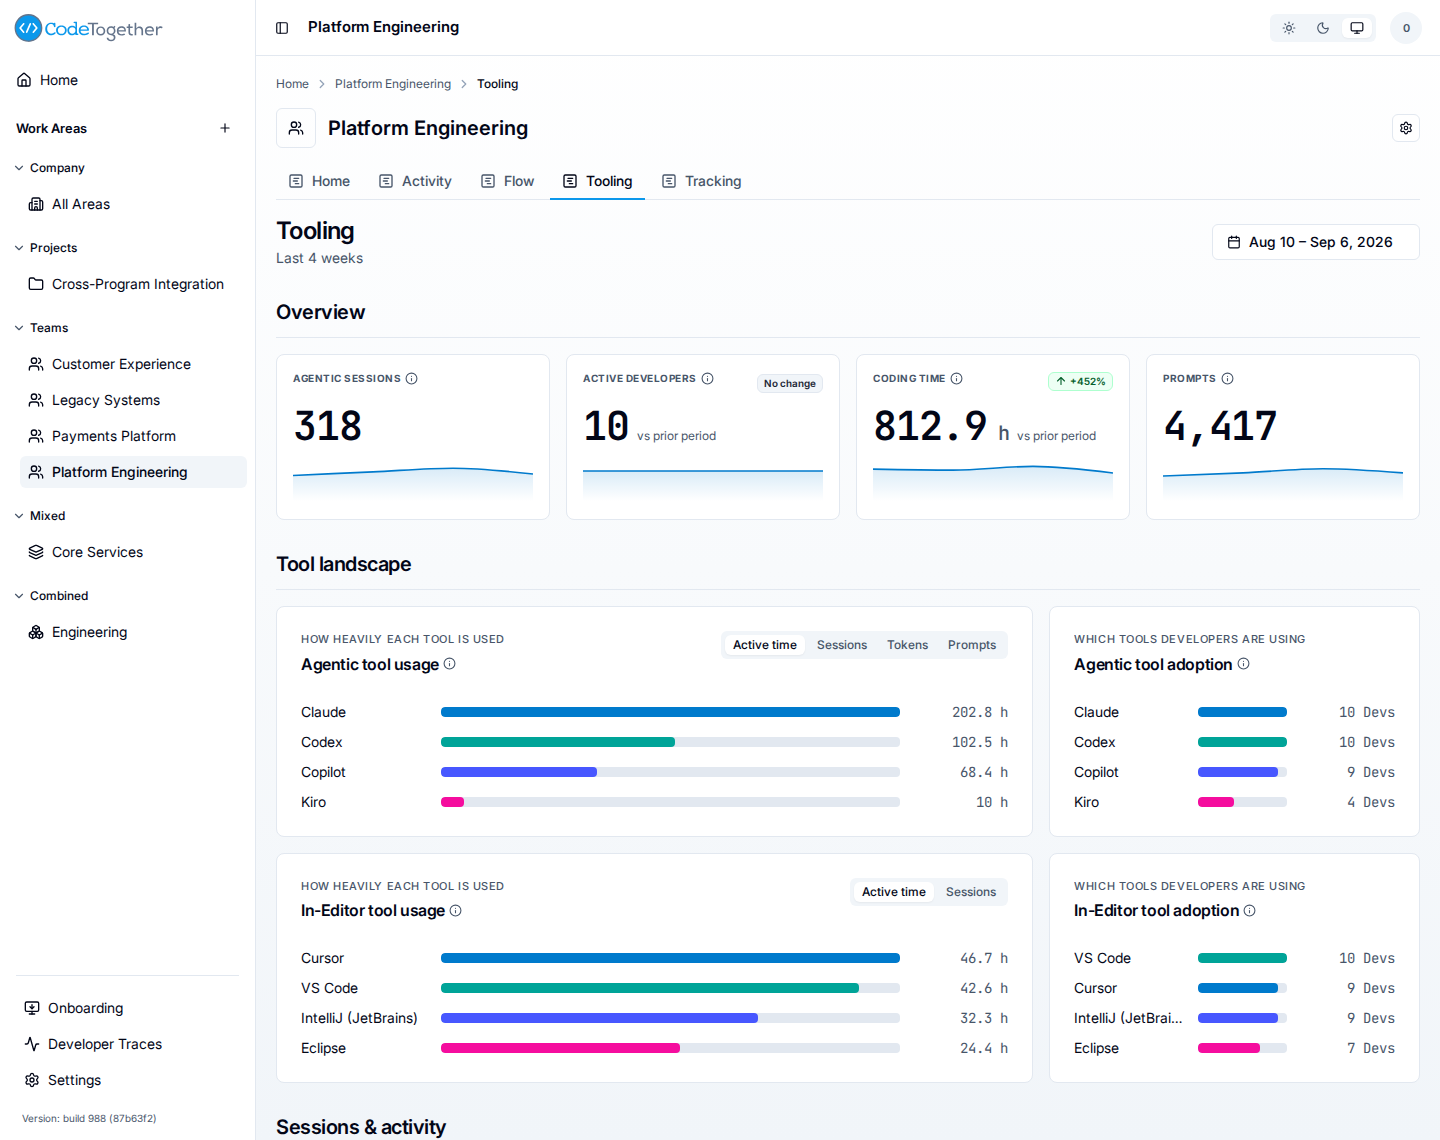
The Tooling dashboard answers which AI tools and editors the team uses, how heavily, and by whom. It has these sections:
- Overview: agentic sessions, active developers, coding time, and prompts. The Overview tile named Coding time reports the shared coding-time clock; where a deployment cannot serve that clock, the tile falls back to a summed measure and reads Total coding time. Active time is a separate measure on this tab, carried by the Tool landscape toggle and the roster column, where it is a summed count of AI-tool session minutes rather than the clock.
- Tool landscape: Agentic tool usage by tool, with a toggle between Active time, Sessions, Tokens, and Prompts, beside Agentic tool adoption, the developer count per tool; and In-Editor tool usage by editor, toggling between Active time and Sessions, beside In-Editor tool adoption. The two pairs of panels are not a split of the same total. The In-Editor pair is filtered to editor hosts, while the agentic pair groups every captured tool, editors included, so an editor's sessions are counted in both pairs and the two do not add up to the team's usage.
- Sessions & activity: the agentic-versus-In-Editor time split, tool-mix trend over time, agentic time by day of week, and average session duration by tool. The tool-mix trend draws one line per tool at that tool's own share of the period's prompts, rather than a stacked area.
- Developer roster: per-developer sessions, active time, tokens, prompts, value points, and AI Spend, with an inline tool-mix bar. AI Spend is this roster's label for the measure the Flow and Home tiles label Agentic spend; the number is the same. Selecting a name opens that person's Developer profile. A spend figure priced from tokens and the model used, rather than reported by the vendor, carries an estimate marker before the number.
The Tracking dashboard shows who is capturing
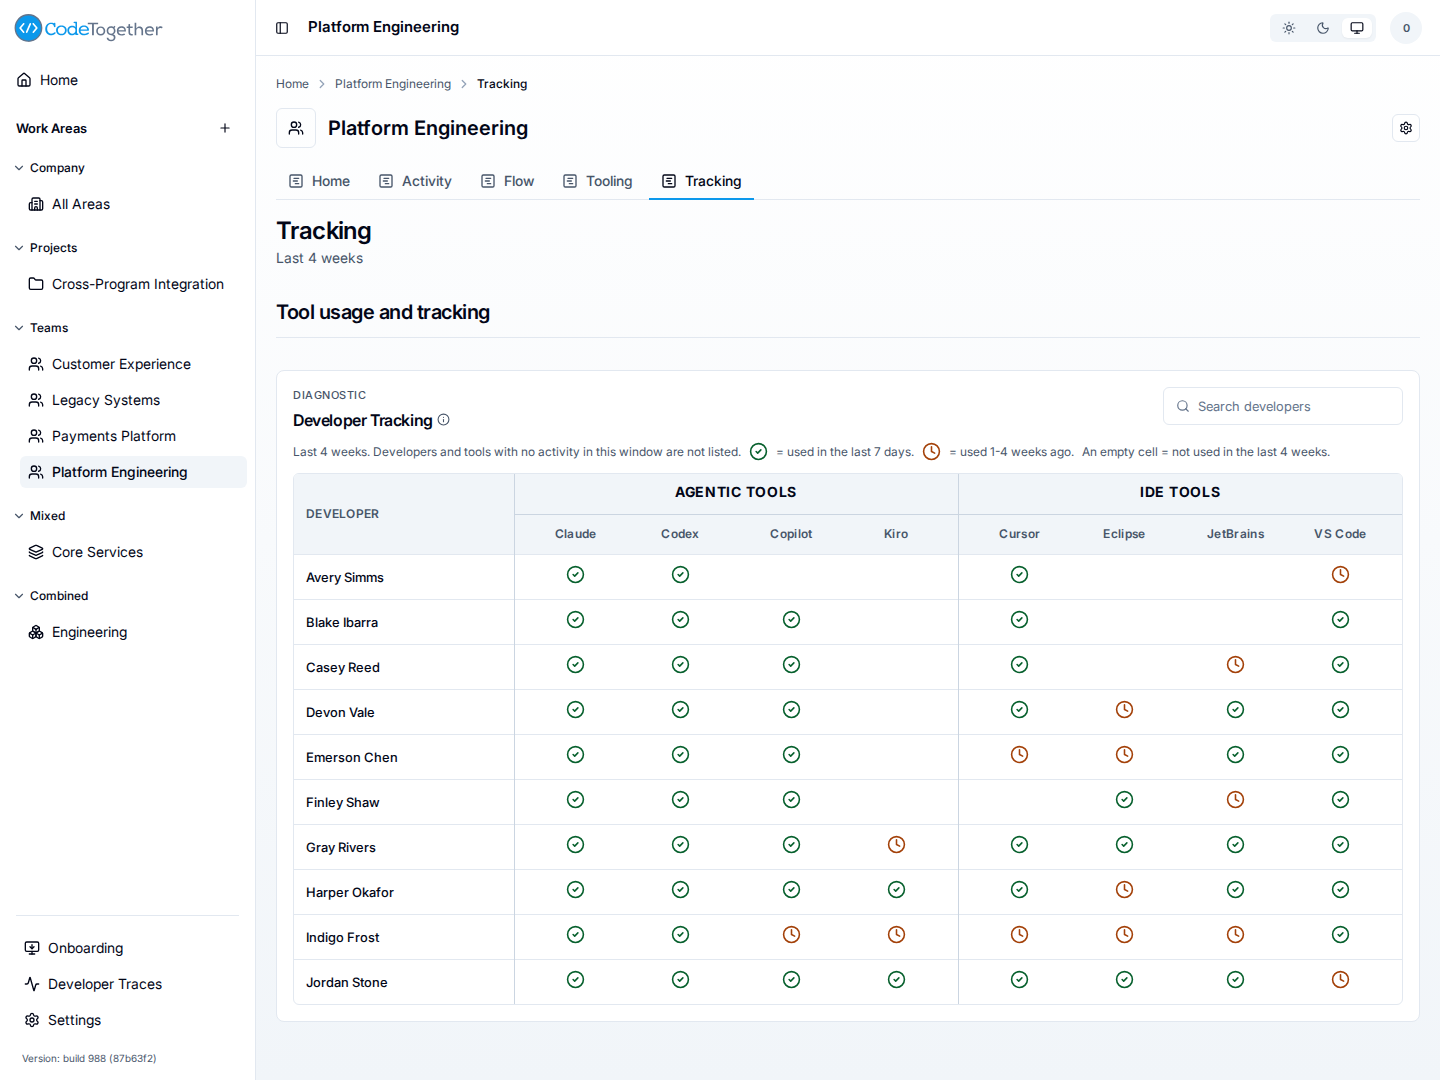
Tracking answers which developers and which tools reported in the last four weeks, so you can tell a quiet team from a broken install. It is the fastest check that a developer's tracker is reporting.
Under the Tool usage and tracking heading, the Developer Tracking roster carries one row per developer and one column per tool, grouped into Agentic Tools and IDE Tools, with a Search developers box. A cell holds one of three states:
- A green check: the developer used that tool in the last 7 days.
- An amber clock: the developer used that tool 1 to 4 weeks ago.
- An empty cell: the developer did not use that tool in the last 4 weeks.
Developers and tools with no activity in the window are not listed at all, so an absent name means no captured activity rather than a missing developer.
Which dashboards a work area shows
Not every work area type shows every tab, and two tabs are gated. The following table lists what each type renders, in tab order, with the gate on any tab that carries one:
| Work area type | Tabs | Gated tabs |
|---|---|---|
| Project, Team, Mixed, Combined | Home, Activity, Flow, Tooling, Tracking | Tracking: a work area Owner or Admin only |
| Company (the All Areas scope) | Activity, Flow, Tooling, Tracking, AI Adoption Report | Tracking: a work area Owner or Admin only. Activity: only while no other work area exists |
A gated tab is absent from the strip rather than disabled, so a reader who does not meet the gate sees a shorter strip with no gap in it.
The company-wide All Areas scope is the only one that carries the AI adoption report, and the only one without a Home tab. For the report ids behind each tab, see Work area templates reference.
Related
- Metrics glossary — the exact definition of every metric on these dashboards.
- AI adoption report — the company-level executive report.
- Developer profile — the per-person view a roster drills into.
- Work areas — the scope every dashboard reads.
- Value points — the output currency behind the VP/$ figures.