Metrics glossary
This page defines every metric you encounter in CodeTogether AI, with what counts and what does not. Read the foundational terms and conventions first, then look up any metric by the surface it appears on.
- Deployment: SaaS, On-premises
A work area's tabs are Home, Activity, Flow, Tooling, and Tracking. For which tab shows which section, see Dashboards.
Foundational terms
The following terms carry weight throughout:
| Term | What it means |
|---|---|
| Developer-day | One developer on one calendar day. Metrics expressed per developer-day count developer-days, so five developers active over four days is twenty developer-days |
| Line-equivalent | A common unit for kept work that puts code and non-code output on one comparable scale. Non-code content is converted using a fixed normalization, and totals are capped so converted work never exceeds the lines actually changed |
| Analytics data | A separate, purpose-built copy of your activity, reorganized for fast reporting. It is derived, so it can always be recomputed from the captured activity underneath |
| Rollups and facts | Captured activity is refined in stages: raw events become work segments, segments and commits become facts, and facts are pre-summed into rollups. Each stage is narrower than the last. These stage names appear as-is in developer traces |
| Retained work | Kept output: work still present at measurement time, not later removed or overwritten. Underpins retention, abandonment, and contribution-mix metrics |
| AI-active day | A day with captured AI or agent activity for the subject. Measured against the subject's active days, not the calendar window |
Two counting conventions
Two conventions apply throughout, and the glossary flags which one a metric uses:
- Effort versus elapsed. Some time metrics count effort, where overlapping sessions add up, and some count elapsed wall-clock time, where overlaps are de-duplicated.
- Additive versus distinct. Some counts are summed across days, so they grow with the window. Some are distinct counts, deduplicated across the window.
The zero-versus-blank convention
The product distinguishes three states, and reading them correctly is how you tell missing data from a real zero:
0means a measured zero.- A blank means not captured. The value is missing, not zero.
- An empty list means measured, none found.
How money is written
Every spend figure renders as a price with its currency code after it, in whole units: $2,470 USD. Amounts below one unit carry two decimals. Chart axis ticks keep the bare symbol.
Headline metrics
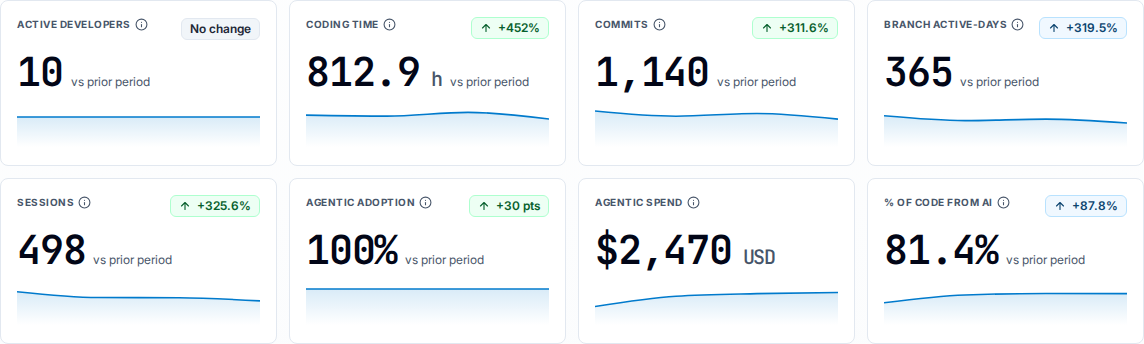
These metrics appear across several surfaces. The following table defines them:
| Metric | Plain-English definition | Counting rule |
|---|---|---|
| Coding time | Elapsed development time in 5-minute blocks of observed activity | A clock, not a sum: a block counts once however many agents, IDEs, machines, or linked identities were active in it, so a developer-day cannot exceed 1,440 minutes. Agent work with no human steer in the preceding 30 minutes counts at a quarter. Browse-only time counts for up to 30 minutes per episode, and that allowance belongs to the developer's whole day, so browsing outside a work area can shorten what the work area shows. Because it is a clock, a work area covering repositories A and B is never A plus B. |
| Commits | Code commits made in scope | Captured natively, no GitHub connection required. Breaks down by branch, repo, or developer |
| Branch active-days | Open-branch load over the period | A count of branch-days a branch was open, additive across days. 14 can be one branch across 14 days or 14 branches on one day. Not a count of distinct branches open right now |
| Sessions | Coding-tool runtime sessions captured | Additive. Splits into IDE sessions (in-editor) and Agent sessions (agent and MCP, Model Context Protocol, tools) |
| Agentic and in-editor | The work split. Agentic is work through an agent, CLI, or MCP tool. In-editor is human-directed work in an IDE, with or without inline AI | Drives many charts: agent sessions, agentic minutes, agentic adoption, and the human-versus-agentic mix |
| Value points | The weighted output-quality currency, comparable across people, tools, and languages, and divisible by cost. As a rough scale, an average engineer using traditional development delivers one to two value points in a week — see Value points | Computed per branch. Where AI analysis is unavailable, labeled output points |
Metrics on the Home, Activity, and Flow tiles
The following table lists the tile metrics, with the tabs that report each one. Home means both the top-level Home page and a work area's Home tab, which carry different tiles:
| Metric | Where it appears | Definition | Counting rule |
|---|---|---|---|
| Active developers | Activity, Flow, Tooling, top-level Home | Distinct people with captured activity in the window | Distinct count, never summed across periods. Includes developers seen only through their commits, with no tracked session, and tracked service accounts. On Activity it is counted from the rows the heat grid loaded, so a trailing plus, as in 10+, marks a count those rows do not fully cover |
| Coding time | Activity, Flow, Tooling, top-level Home | Captured hands-on developer time | See Coding time (a clock, not an effort sum). On an Activity tab whose work area is scoped to repositories the tile instead reads Repository coding time and reports repository-day minutes, where a block spent in two of the area's repositories counts in each. That figure is not the clock and does not match Flow |
| Contributors observed | Work area Home | People with captured work in the period | Distinct count. |
| Commits observed | Work area Home | Commits captured in the period, across the area's repositories | Additive, with the repository count beside it. |
| Merges observed | Work area Home | Merges captured in the period | Needs a source-control connection. Without one the tile reads Unavailable rather than zero. |
| Code areas worked | Activity | Distinct repository and directory pairs with captured activity | Distinct count over the window, taken before the grid compacts its rows for display, and excluding activity with no directory attributed. A trailing plus, as in 121+, marks partial row coverage. |
| AI sessions | Top-level Home | Runtime sessions captured | IDE plus agent sessions, additive |
| Agentic adoption | Flow, top-level Home | Share of developers with a sustained pattern of agentic work: at least two days with agent activity, not merely one | Divided by developers with at least one tracked active day, which can be fewer than the Active developers tile beside it. |
| Agentic spend | Flow, work area Home, top-level Home | Dollar cost of captured AI usage, across the team for the period | Vendor-reported cost where a usage feed supplies it; otherwise the platform prices the captured tokens against its built-in rate card, which is list pricing rather than your organization's negotiated rates. A figure priced that second way carries an estimate marker where the surface shows one |
| % of Code from AI | Flow, work area Home | The agentic share of the attributable code kept in the period | Retained agentic value points divided by retained agentic plus human value points; work that cannot be attributed to either side is left out of both, so the two sides total 100%. The same figure as the Agentic slice of the Flow contribution mix. A work area's Home tab labels it AI code contribution, and the AI adoption report labels it AI-authored share. |
| Lines changed | Flow trends | Lines added plus deleted | Summed over the window |
| Retained output | Flow trends | Kept work, in line-equivalents | Capped line-equivalents of work that survived, across all work models |
| Commit-to-push lag | Flow work status | Average time from a commit to the push that carried it to the remote | Hours, averaged across commits observed pushed; a commit never observed pushed is excluded rather than counted as zero or infinite |
Not every tile carries a comparison badge, and the Activity tiles carry none. Where a tile does compare against the prior period, a share such as Agentic adoption reports the movement in percentage points (+30 pts) and every other tile reports a relative change (+14.7%); % of Code from AI is the one share that reports a relative change. Where the two periods match the badge reads No change, and where there is no prior period it is hidden.
Metrics on the Tooling dashboard
The following table lists the tooling metrics:
| Metric | Definition | Counting rule |
|---|---|---|
| Agentic sessions | Agent and MCP runtime sessions captured | Additive |
| Coding time | Captured development time for the team | The Overview tile reports the shared Coding-time clock. Where a deployment cannot serve the clock, the tile falls back to a summed measure and reads Total coding time. |
| Prompts | Prompt events captured | Sum |
| Active time | Time spent in AI tools, per tool and per developer | An effort sum of session minutes, so it is not the Coding-time clock. Drives the tool-usage toggle and the roster column of the same name |
| Per-tool active time, sessions, tokens, prompts | Usage per AI tool, one measure at a time from the panel's toggle | Summed and grouped by tool |
| Agentic tool adoption, In-Editor tool adoption | Developers who used each tool in the period | Distinct developers per tool, in the panel beside the matching usage panel |
| Average session duration by tool | Typical session length per tool | Elapsed wall-clock minutes, divided by sessions |
| In-Editor tool usage | Usage by IDE (VS Code, Cursor, VSCodium, IntelliJ and other JetBrains IDEs, Eclipse, Visual Studio) | Editor-host sessions, minutes, and developers, excluding agent and MCP |
| Agentic versus in-editor time | The elapsed-time split | Agentic wall-clock versus IDE wall-clock minutes |
| AI Spend | Dollar cost of a developer's captured AI usage | The roster column, over the same measure as the Agentic spend tile, covering every captured AI surface including in-editor assistants. A figure priced from tokens and the model used, rather than reported by the vendor, carries an estimate marker before it. |
Metrics on the Tracking dashboard
Tracking reports recency rather than a measured quantity. The following table lists what a cell in the Developer Tracking roster means:
| Cell | What it means |
|---|---|
| Green check | The developer used that tool in the last 7 days |
| Amber clock | The developer used that tool 1 to 4 weeks ago |
| Empty | The developer did not use that tool in the last 4 weeks |
Developers and tools with no activity in the four-week window are left out of the roster, so an absent name means no captured activity rather than a missing developer.
Metrics on the Developer profile
The following table lists metrics that appear on the Developer profile and nowhere else:
| Metric | Definition | Counting rule |
|---|---|---|
| High-AI-usage days | Days above the AI-intensity threshold | A day counts when prompts reach 10 in a day, or tool calls reach 10 in a day. |
| Completion rate | Share of the developer's tracked work items completed in the window | A proxy metric: completed work items divided by all tracked work items. Not an AI-suggestion-acceptance rate |
| Stale work | Stale, abandoned, locally unresolved, or follow-up work items | An open work item counts once it has gone 14 days without movement. Reported on the Developer profile, not on the Flow overview |
| Adoption depth | Share of the developer's active days with captured AI activity | AI-active days divided by active days, derived from the profile's own day tiles. |
| Agent-driven sessions | Share of all captured sessions that were agentic rather than in-editor | Agent sessions divided by IDE sessions plus agent sessions. In-editor sessions count even when no AI was used. This is session mode, not retained work, so it need not match the work contribution split |
Metrics on the AI adoption report
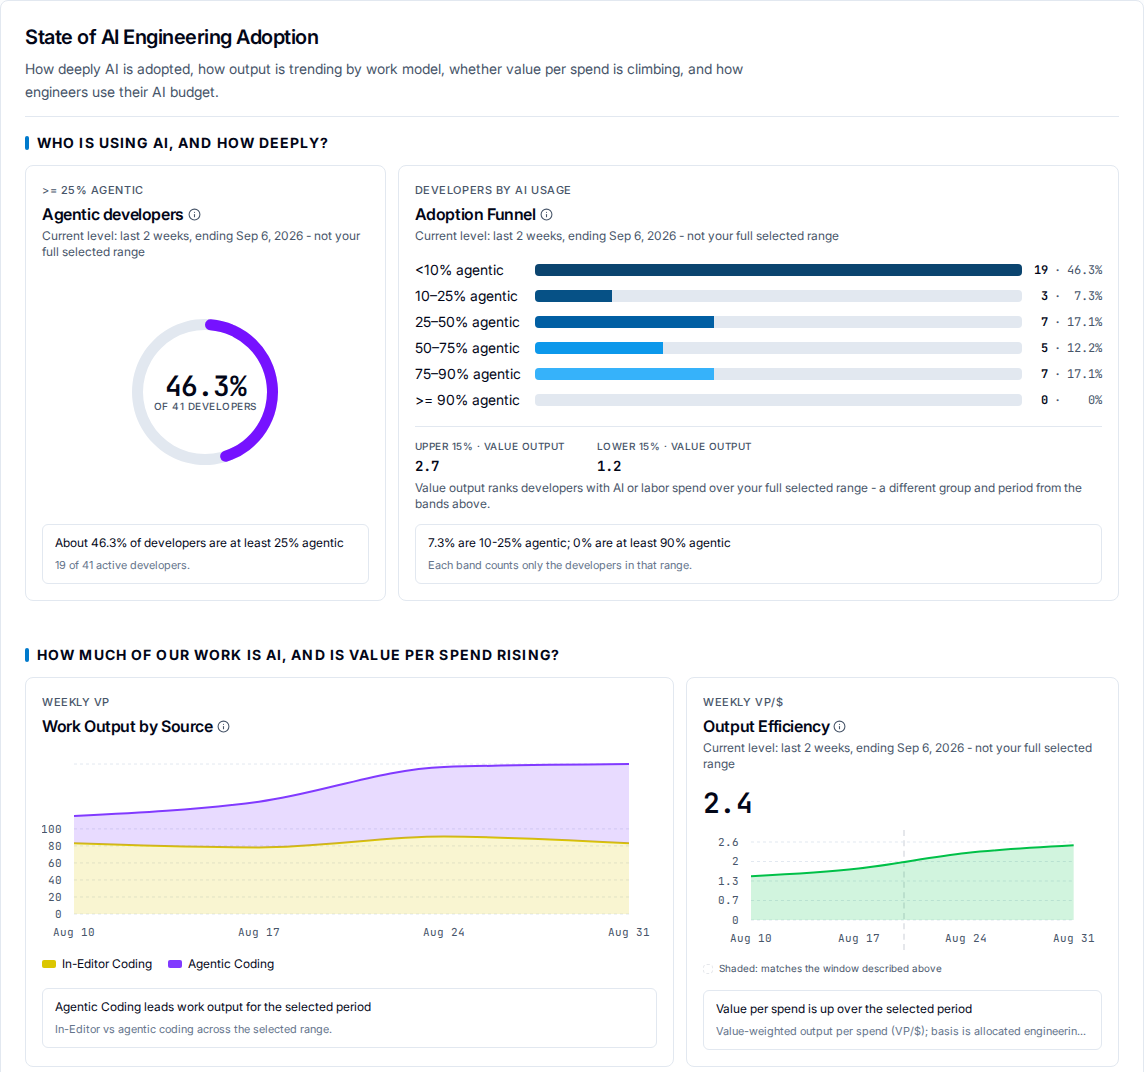
The following table lists the report metrics:
| Metric | Definition | Counting rule |
|---|---|---|
| AI adoption rate | Share of developers using any AI | Distinct developers with any AI-active day, divided by developers with at least one tracked active day. That denominator is the same as Agentic adoption's, and narrower than the Active developers tile, which also counts developers seen only through their commits. A wider measure than Agentic adoption, which requires a sustained pattern of agent work |
| AI-authored share | The agentic share of the attributable code kept in the period | The same measure as % of Code from AI on Flow. It describes composition, so no target is set for it. |
| Output efficiency (VP/$) | Value points per unit of allocated engineering and AI cost | Value points divided by total allocated engineering plus AI cost, then scaled to the workspace's spend basis, which defaults to $1,000. The raw per-single-dollar quotient is never displayed, so read the figure against that basis rather than against one dollar |
| Cost per value point | Dollars per value point produced | Allocated cost divided by value points |
| Acceleration factor | How many times more value per dollar agentic returns versus in-editor | Agentic VP/$ divided by in-editor VP/$. A measured in-editor comparison needs at least five in-editor developers and at least a tenth as many in-editor as agentic developers; below that the denominator falls back to the Industry Baseline from your cost policy and the figure is badged as estimated |
| Value per headcount | Value-weighted output per working head | Retained units divided by active developers |
| Budget utilization | Share of developers using 80% or more of their AI token budget | Distinct developers at 80% or more of quota, divided by developers with at least one tracked active day. Tokens and quota are summed over the window, and both sides exclude service, test, and provider-only identities |
AI code and retention metrics
The following table lists the code-quality metrics:
| Metric | Definition | Counting rule |
|---|---|---|
| AI code retention | Share of AI-generated work that was kept | Retained AI line-equivalents divided by generated AI line-equivalents |
| AI abandonment rate | Share of AI work later removed | The complement of retention, per developer on the profile |
| Work-model contribution mix | Output share by work model | A two-way In-Editor versus Agentic share of retained value points on every surface that renders it: Flow's Work status panel, the Developer profile's work contribution card, and the AI adoption report's output-share chart. The report's work-model table names its rows Agentic Coding, Human w/ AI, In-Editor Coding, and Unknown AI |
| Waste cost | Dollar value of discarded AI work | Session-level discarded-cost components |
Related
- Value points — what value points measure.
- Dashboards — where these metrics appear.
- AI adoption report — the report these adoption metrics drive.
- Validate data with developer traces — auditing any metric to its source.