Developer profile
A developer profile is one developer's engagement, recent work, and agentic tool usage over the selected period. You reach it by selecting a name in any roster, on a dashboard or in developer traces.
- Deployment: SaaS, On-premises
The profile is a read of one person's captured work. For the exact definition of any metric on it, see the Metrics glossary.
What the profile covers
The breadcrumb records the roster you arrived from, so a profile opened from a work area's Flow tab reads Home > work area > Flow > Developer profile. The date range is set on the profile itself rather than carried over from the roster, and it applies to every section on the page.
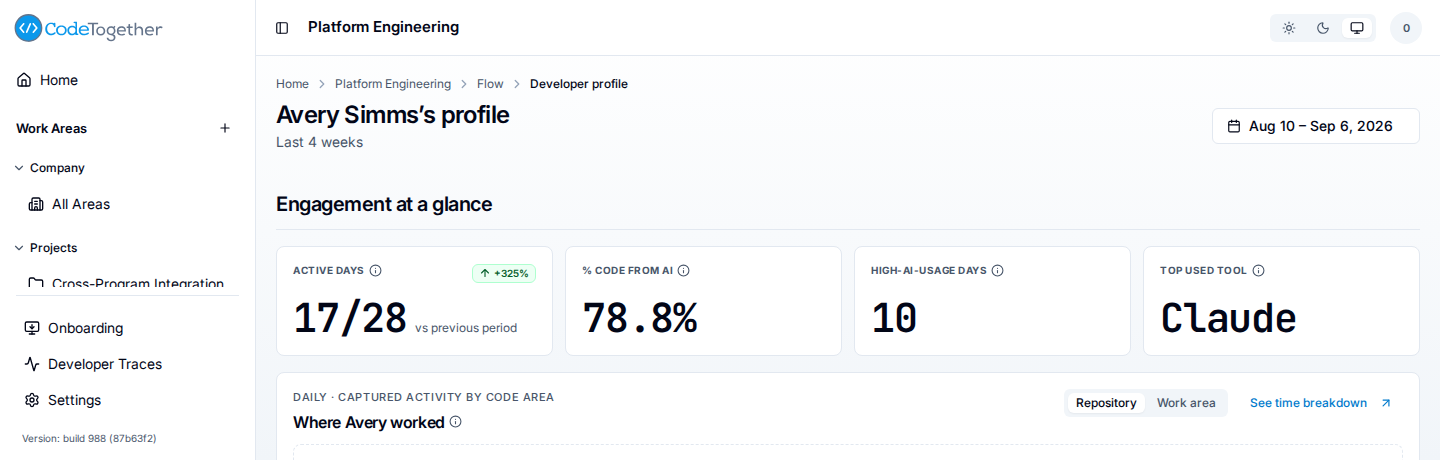
The profile is organized into four sections.
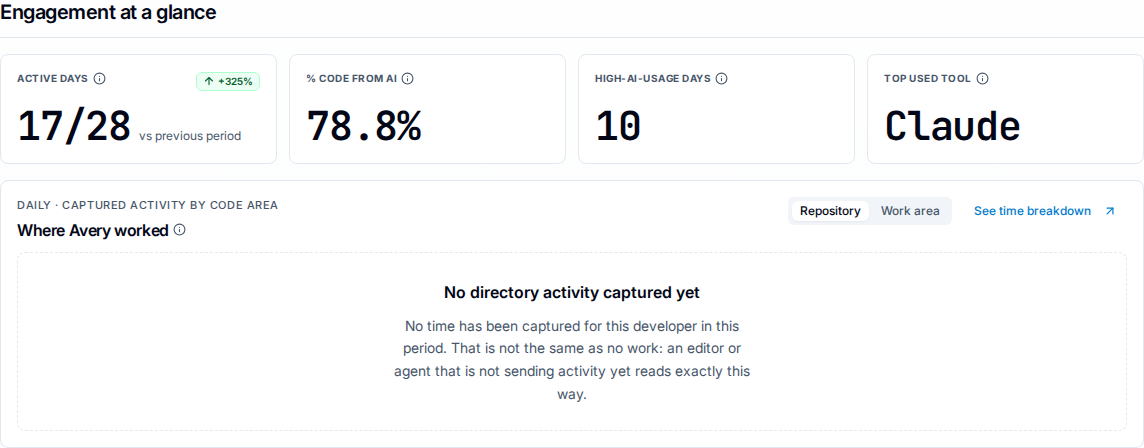
Engagement at a glance carries four tiles (Active days, % Code from AI, High-AI-usage days, and Top used tool) over a card that maps captured activity onto the code areas the person touched. The card is titled with the developer's first name, Where Avery worked in the figure, and reads Where this developer worked when no first name is on record. It has a See time breakdown link and, when work-area activity is available, a Repository and Work area toggle.
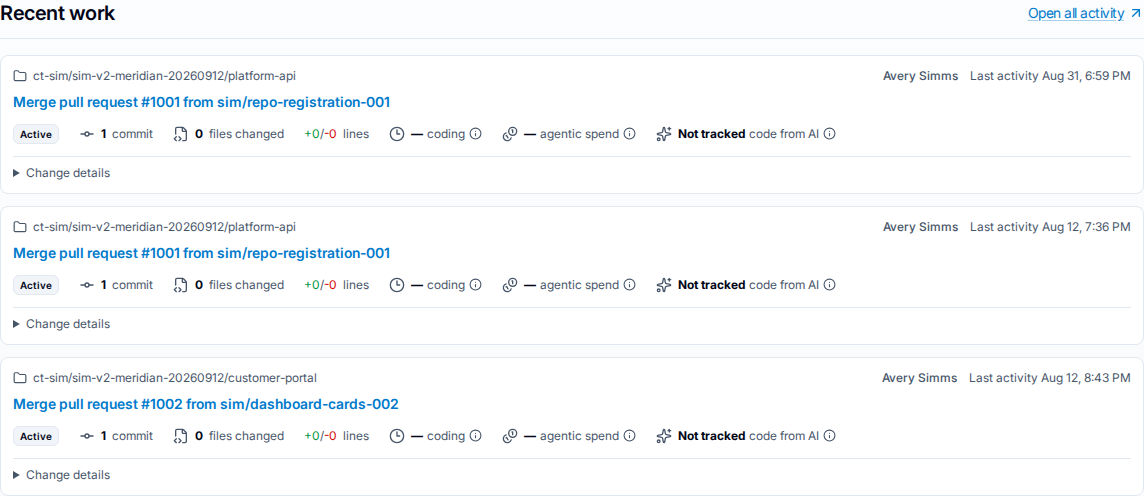
Recent work lists the changes the developer worked on, one card each, with the repository, the branch or merge title, a status such as Active, Pushed, or Merge observed, and the commits, files changed, lines, coding time, agentic spend, and share of code from AI for that change. Change details expands a card in place; it reads Source areas & details when the change carries directory paths. Selecting a card's title opens a Work details drawer. Open all activity opens a Recent changes page listing every tracked change for the developer in the period, with its own search and sort.
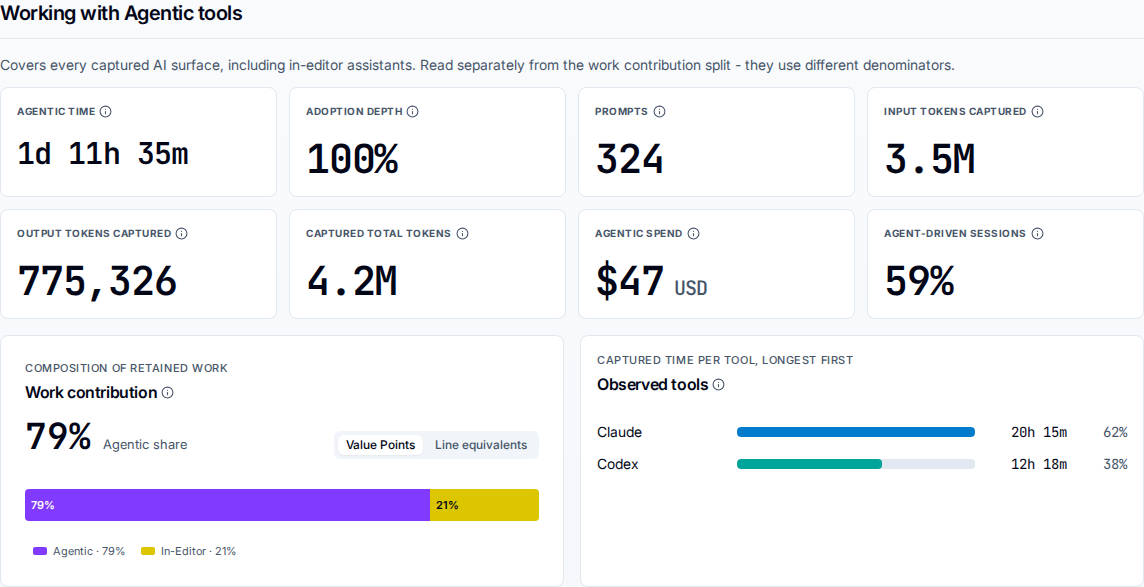
Working with Agentic tools holds eight AI usage tiles (Agentic time, Adoption depth, Prompts, Input tokens captured, Output tokens captured, Captured total tokens, Agentic spend, and Agent-driven sessions) over two cards: Work contribution, the agentic and in-editor split of retained work, switchable between Value Points and Line equivalents, and Observed tools, captured time per tool longest first.
Change volume closes the page with Commits, Files changed, Lines changed, and a Review-risk score.
The two AI reads answer different questions
Working with Agentic tools and Work contribution look alike and count different things, which is the most common misreading of this page. The product states the distinction on the section itself: the tiles cover every captured AI surface, in-editor assistants included, while the contribution split is attribution of retained work.
- Agentic time, prompts, tokens, and spend are captured usage. They count what the tools did, whether or not the resulting code survived.
- Work contribution is attribution. It reflects who wrote the kept lines, not how long an editor was open, so in-editor work in that split can still have involved AI.
Reading one as a check on the other produces a discrepancy that is not there. They use different denominators.
Some fields are deliberately blank
The profile follows the platform's honesty convention: a field shown as not yet available is telling you the evidence is missing, not that the value is zero. Those fields are shown as unavailable rather than guessed at.
The code-areas card is the clearest example. With no captured time for the developer in the period it reports No directory activity captured yet, and says that this is not the same as no work: an editor or agent that is not sending activity yet reads exactly this way.
Two reads in particular are worth understanding:
- The human-versus-AI split is based on retained work attribution, not on IDE time. It reflects who wrote the kept lines, not how long an editor was open.
- Unattributed work is left out of the split. Kept lines that carry no human or AI evidence are not forced onto one side, which can make the split cover less than all of the person's work.
A Recent work card can also show a placeholder in place of its share of code from AI: Not tracked, Mixed units, Coverage gap, Unknown origin, or No retained code. That is the same convention at the level of a single change: the change was captured, and the placeholder says why its origin was not attributed.
Related
- Members and developers — how a person's captured activity forms their identity.
- Value points — the human and AI split shown on the profile.
- Validate data with developer traces — auditing the numbers behind a profile.
- Metrics glossary — the profile's metrics defined.