Validate data with developer traces
Use this guide to verify where a dashboard number came from. Every headline number is a rollup; developer traces are the drill-down that walks all the way to the underlying commits, sessions, and analysis records. Use it whenever someone asks "where did this number come from?" or "why does this look off?"
- Deployment: SaaS, On-premises
- Role: Owner, Admin
Developer traces are restricted to organization Owners and Admins — see Roles reference. They work whether or not an AI analysis provider is connected.
Every screenshot on this page shows a sample dataset, so the developer names, repository names, branch names, and figures in them are generated rather than real.
The three levels
Developer traces is three stacked views. You drill down through them, following the breadcrumb Home > Developer Traces > developer > branch:
- Recent activity: the fleet-wide entry view, listing active developers with per-developer session, commit, and branch counts and a status pill. Start here to confirm the person and period.
- A developer trace: one person's work-branch cards and runtime sessions, with capture-coverage totals so you can see how complete the underlying capture is.
- A work branch: the leaf. The full forensic breakdown of a single branch.
1. Confirm the person and period
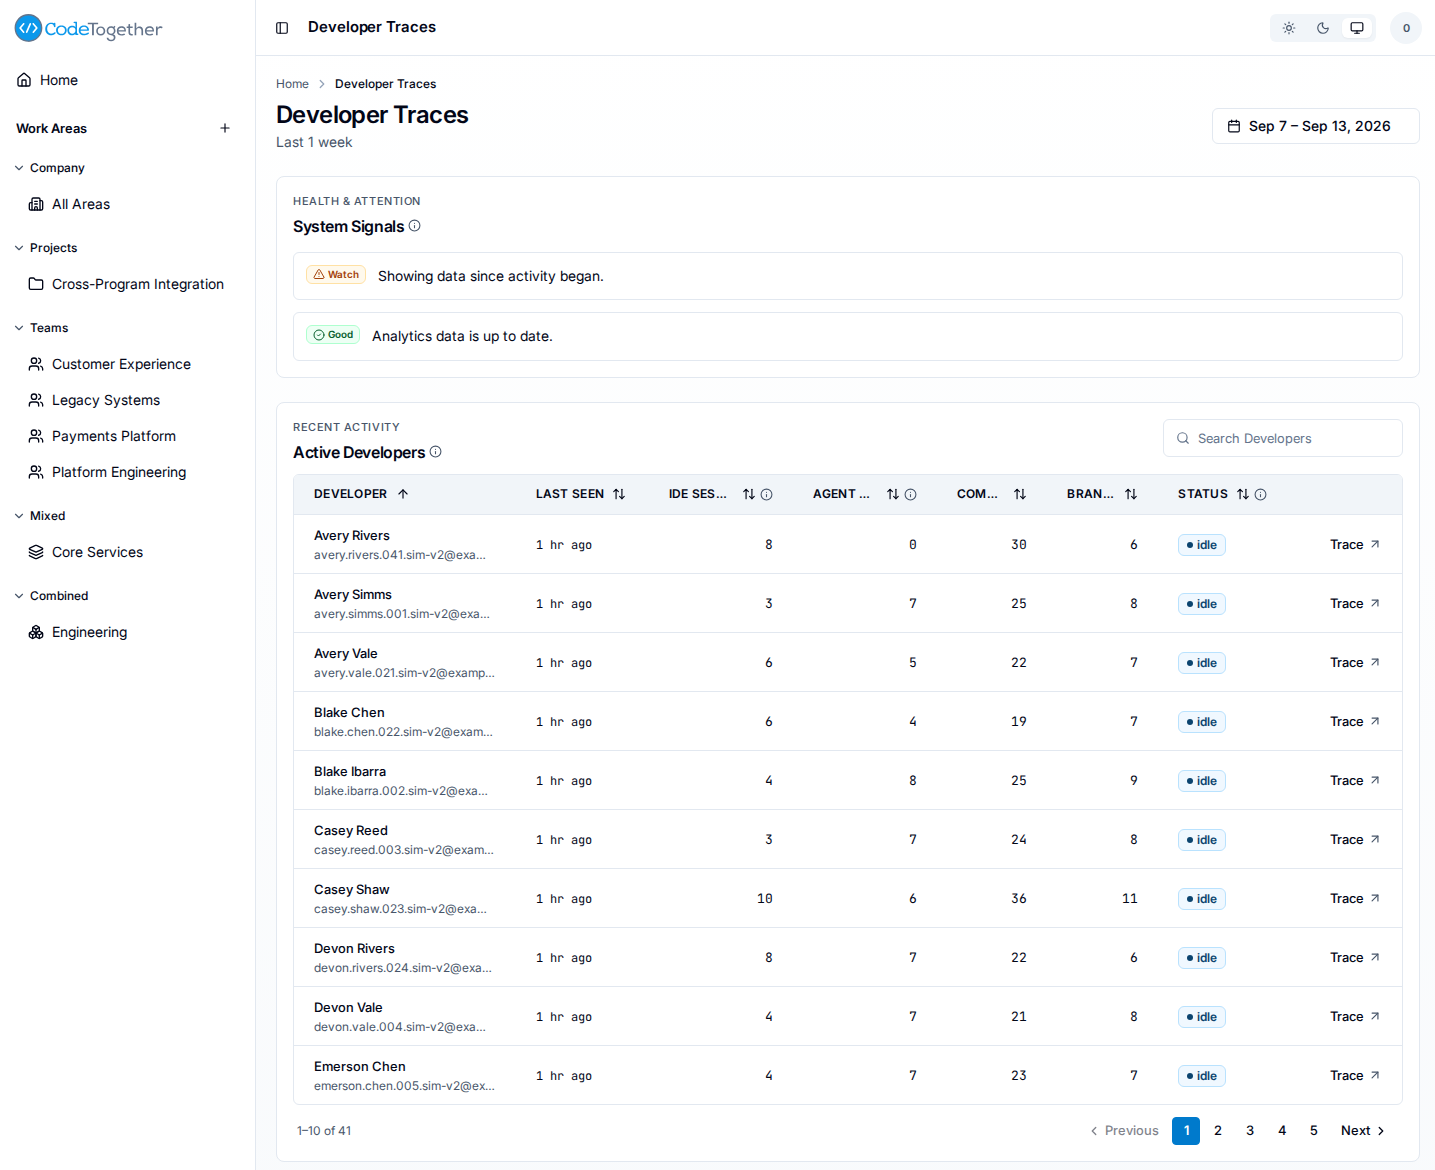
Open developer traces from the left sidebar. It opens on Recent activity. Check the System Signals panel at the top, then find the developer in the Active Developers roster and confirm their session, commit, and branch counts look right for the period.
All three trace views open on the last 7 days including today, and each carries its own date control at the top right. That window belongs to the trace pages, so a period you set on a dashboard does not carry here. Widen the range before concluding that a developer's counts are thin.
The Status pill reads recency, not volume: active under 30 minutes, idle 30 minutes to 2 hours, stale 2 hours or more, and unavailable when no activity timestamp exists at all. The info icon on the Status header states the same thresholds. A developer with a full period of commits still reads stale if nothing has arrived recently, so read Status as "when did this last land", not "how much landed".
2. Open the developer, then the branch
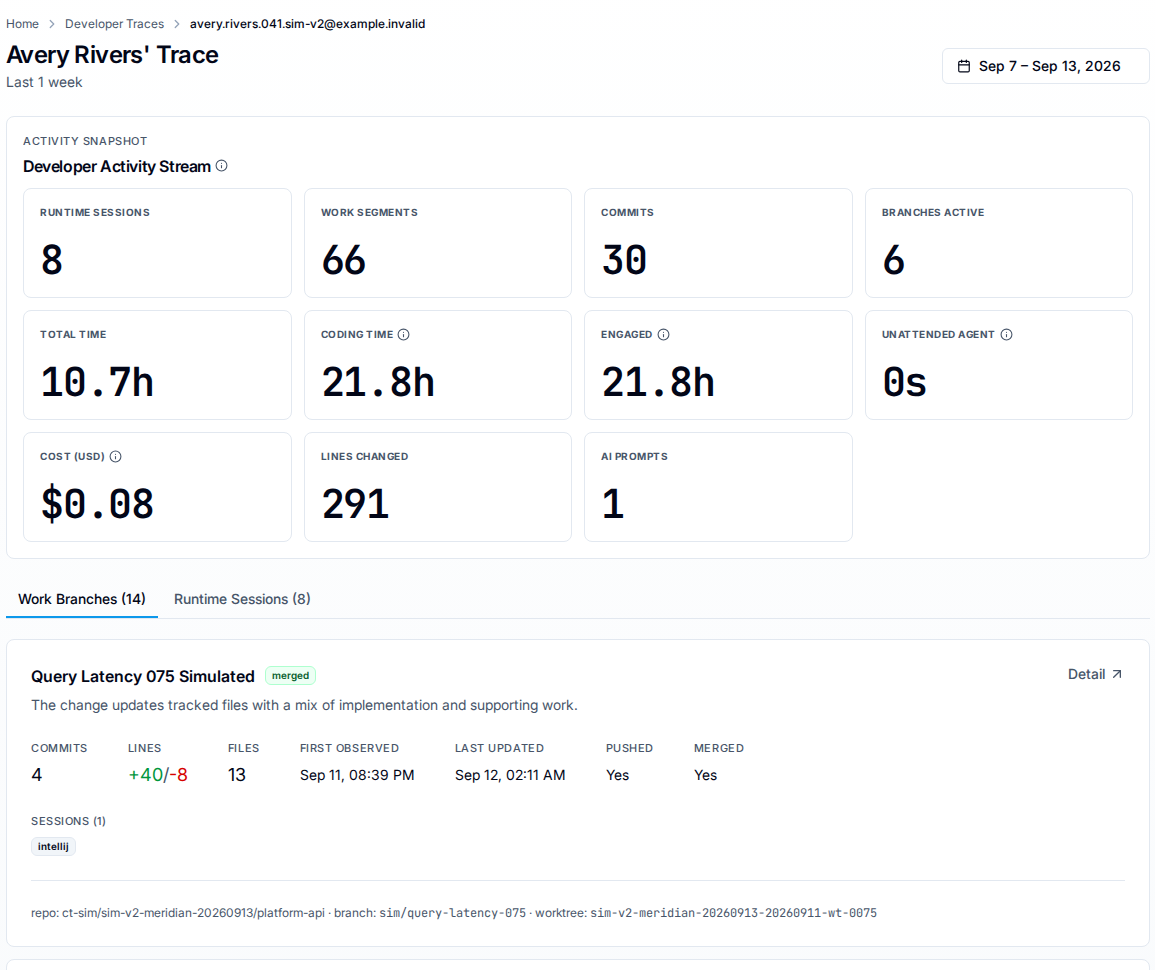
Select Trace on the developer's row to see their work-branch cards and runtime sessions, then select Detail on the branch whose number you are checking.
A developer's trace opens on the Developer Activity Stream summary, then splits into two tabs, Work Branches and Runtime Sessions, each carrying its own count. Work Branches is the default; every card breaks its own sessions out under a Sessions row, so one branch's sessions are never inferred from the developer's total.
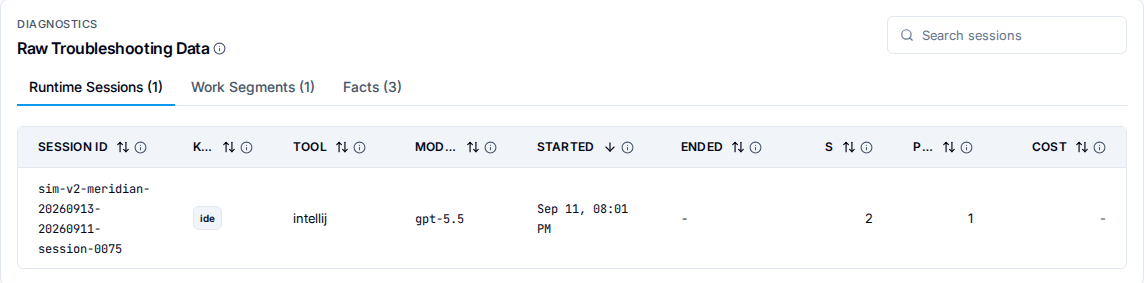
On the Runtime Sessions tab, the Source column says how each session reached the platform: CT for an older client reporting before native reporting existed, Native OTEL for a session the AI tool reported live itself, Harvested for one estimated afterwards from local usage data, and Both when native and harvested data are both present. The Model column says how the work was produced — agent (AI), human-only, or human with AI assistance. Careful: the Model column in the branch view's Raw Troubleshooting Data is a different measure, the AI model backing the session.
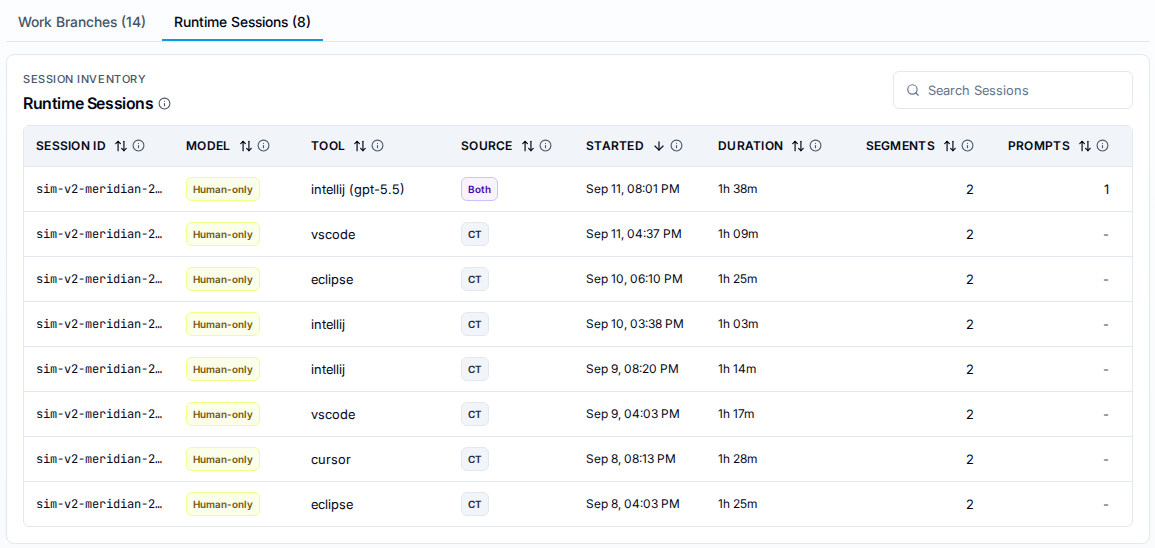
Source matters when a count looks low: a fleet reporting entirely as CT is capturing, but not through a tool's own native telemetry — and CT is also what a session shows when no collection source was recorded for it at all, so read it as "not natively reported" rather than as proof of an old client. Session IDs are long, so the column truncates and shows the full value on hover.
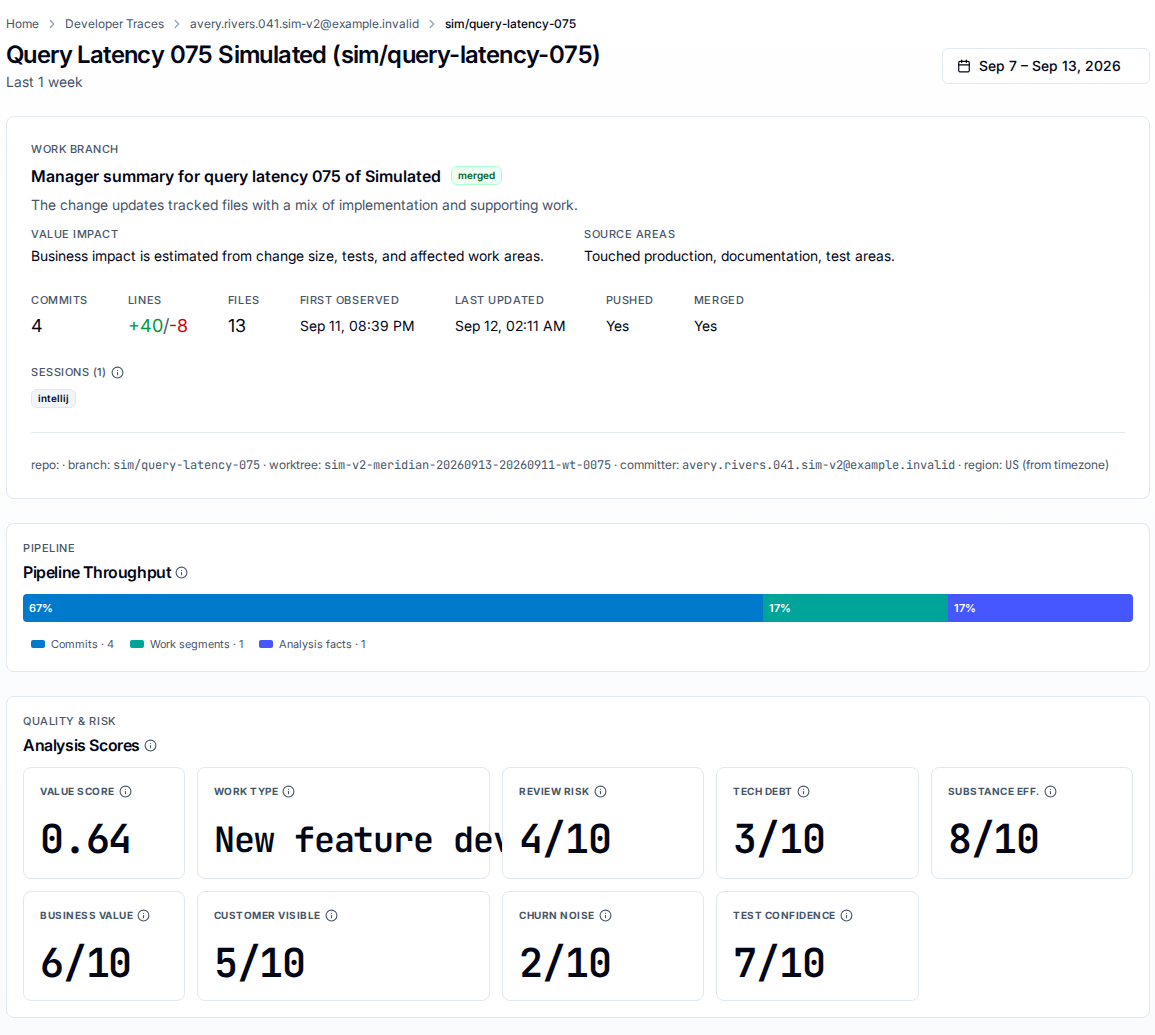
The work branch view is where numbers become auditable. It shows the branch header (name, repo, committer, commit and line counts, whether and when it was pushed and merged), and a Sessions row that lists one pill per runtime session with captured activity on the branch. The count above those pills is every session on the branch, while the pills themselves show only the runtime-session page currently loaded, so the two can differ; the info icon beside the row says so and points at the Runtime Sessions table under Raw Troubleshooting Data.
The footer line ends in region: followed by a region code and, in brackets, how that region was resolved — (from timezone) and (from locale fallback) are the two you will usually see. Nothing renders there when no region was resolved for the committer, which is normal rather than a gap.
It also shows a proportional pipeline bar from commits to work segments to analysis facts, the analysis-score tiles the value points are built from, per-session retained versus abandoned contributions, per-commit detail, and per-file retention.

The deepest layer, Raw Troubleshooting Data, exposes the runtime sessions, work segments, and analysis facts directly.
3. Reconcile against the headline number
Walk the commits, sessions, and analysis facts against the number you started from. If they add up, the rollup is sound. Each stage of the pipeline is narrower than the last, which is why developer traces is where you see exactly where data thins out.
How to read a number that looks wrong
The product follows a strict honesty convention, which is what makes this validation reliable:
0means a measured zero. A blank means not captured. An empty list means measured, none found. A blank value is telling you data is missing, not that the value is zero. In a table, that blank renders as a dash (-).- Check data quality first. The System Signals panel on Recent activity reports how fresh and how complete the analytics behind the page are, so read it before you go hunting for a bug.
- Analysis-gated tiles show unavailable, not zero, when the AI review has not run yet. A missing score is a coverage gate, not an error.
- Unattributed work is left unattributed, not guessed. Kept lines that carry no human or AI attribution are left out of the split rather than guessed, which can legitimately make credited totals look smaller than a raw line count.
Troubleshooting
A developer appears only partly in reports
This is often an identity split: the same person committing under more than one email. Check the developer identities link at Settings > Developers, then recalculate. Confirming an identity link queues a rebuild of your analytics.
A number is thin right after activity
Rollups build after ingestion, and the System Signals panel says whether the analytics behind the page are up to date for the window. Allow processing to catch up before treating a thin number as a fault.
If this doesn't fix it
Contact support with all of the following. Tickets missing these take longer to resolve:
- The dashboard number in question, the work area, and the period.
- The developer, branch, and repo from the breadcrumb.
- Whether an AI analysis provider is connected, and the wording of every System Signals row and its state.
- Your deployment kind and, for on-premises deployments, your server version.
Related
- Confirm data is being collected — the server-side check that data arrived before drilling into what it shows.
- Value points — what the analysis-score tiles on a branch feed, including the human and AI attribution split.
- No activity appears for a developer — when a developer is missing entirely.