Confirm data is being collected
Use this guide to confirm, from the server side, that developer activity has actually arrived — not that a workstation is configured, but that data landed. A configured workstation and captured data are two separate claims, and the portal home page does not distinguish them.
- Deployment: SaaS, On-premises
- Role: Owner, Admin
Every screenshot on this page comes from a demonstration environment. The developer names, repository names, and figures in them are generated, and the licence, seat, and build values visible in the System health section are that environment's own — none of them are a customer's.
What the connection tile does not tell you
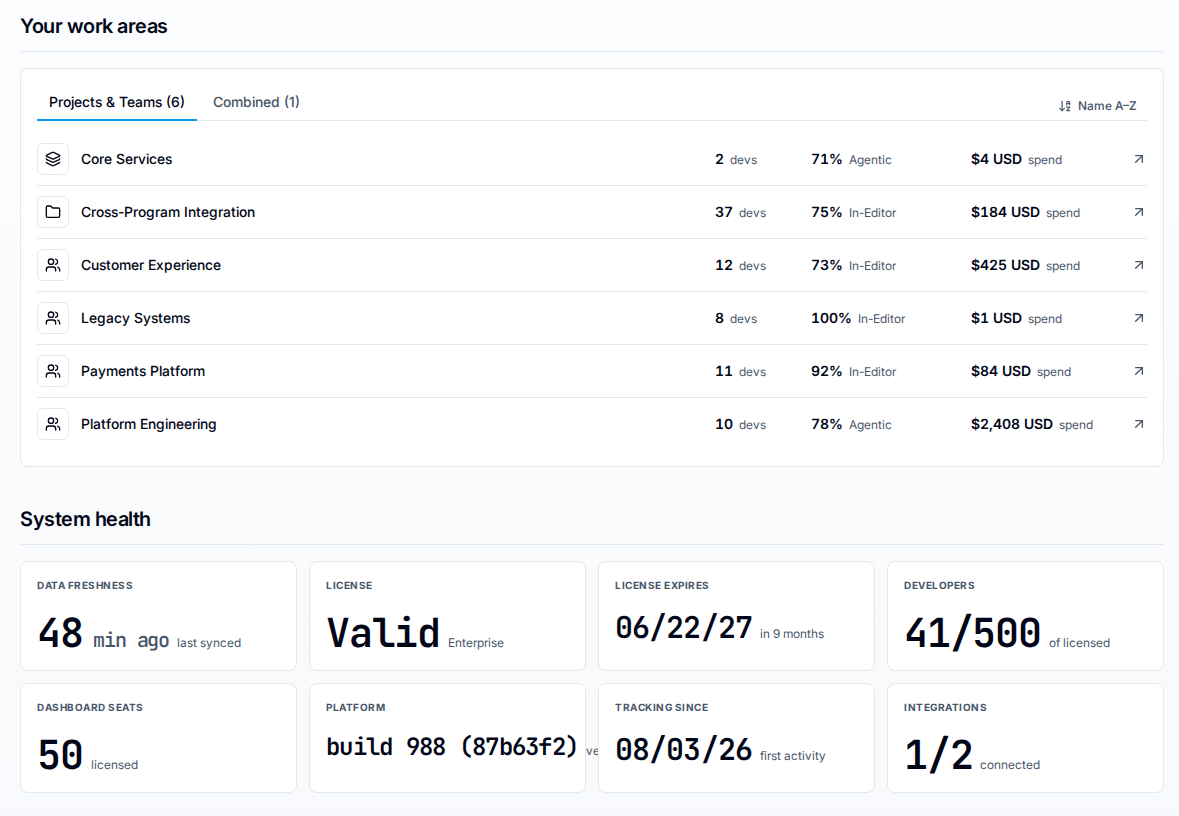
The connection tile — labeled Integrations in the System health row on Home — shows how many integrations are connected: source control and AI analysis. It reads as a fraction, such as 1/2 connected, and changes when you add or remove a provider.
If you administer the organization, System health is the last section on Home, after Your work areas, so scroll to the foot of Home to reach it.

It answers one question: are the right integration accounts linked? It does not show whether a developer's workstation is tracking, whether any data has been ingested, or whether a specific developer's activity has arrived. Do not use it as evidence that collection is working.
1. Open developer traces
Select Developer Traces from the left sidebar. It is in the pinned group at the foot of the sidebar, below the work-area list and above Settings, not in the work-area list itself. The page opens on the Recent activity section, a fleet-wide roster scoped to the date range shown at the top right of the page — the last 7 days including today, by default. That window belongs to the trace pages rather than to the range the dashboards share, so a range you set on a dashboard does not carry here.
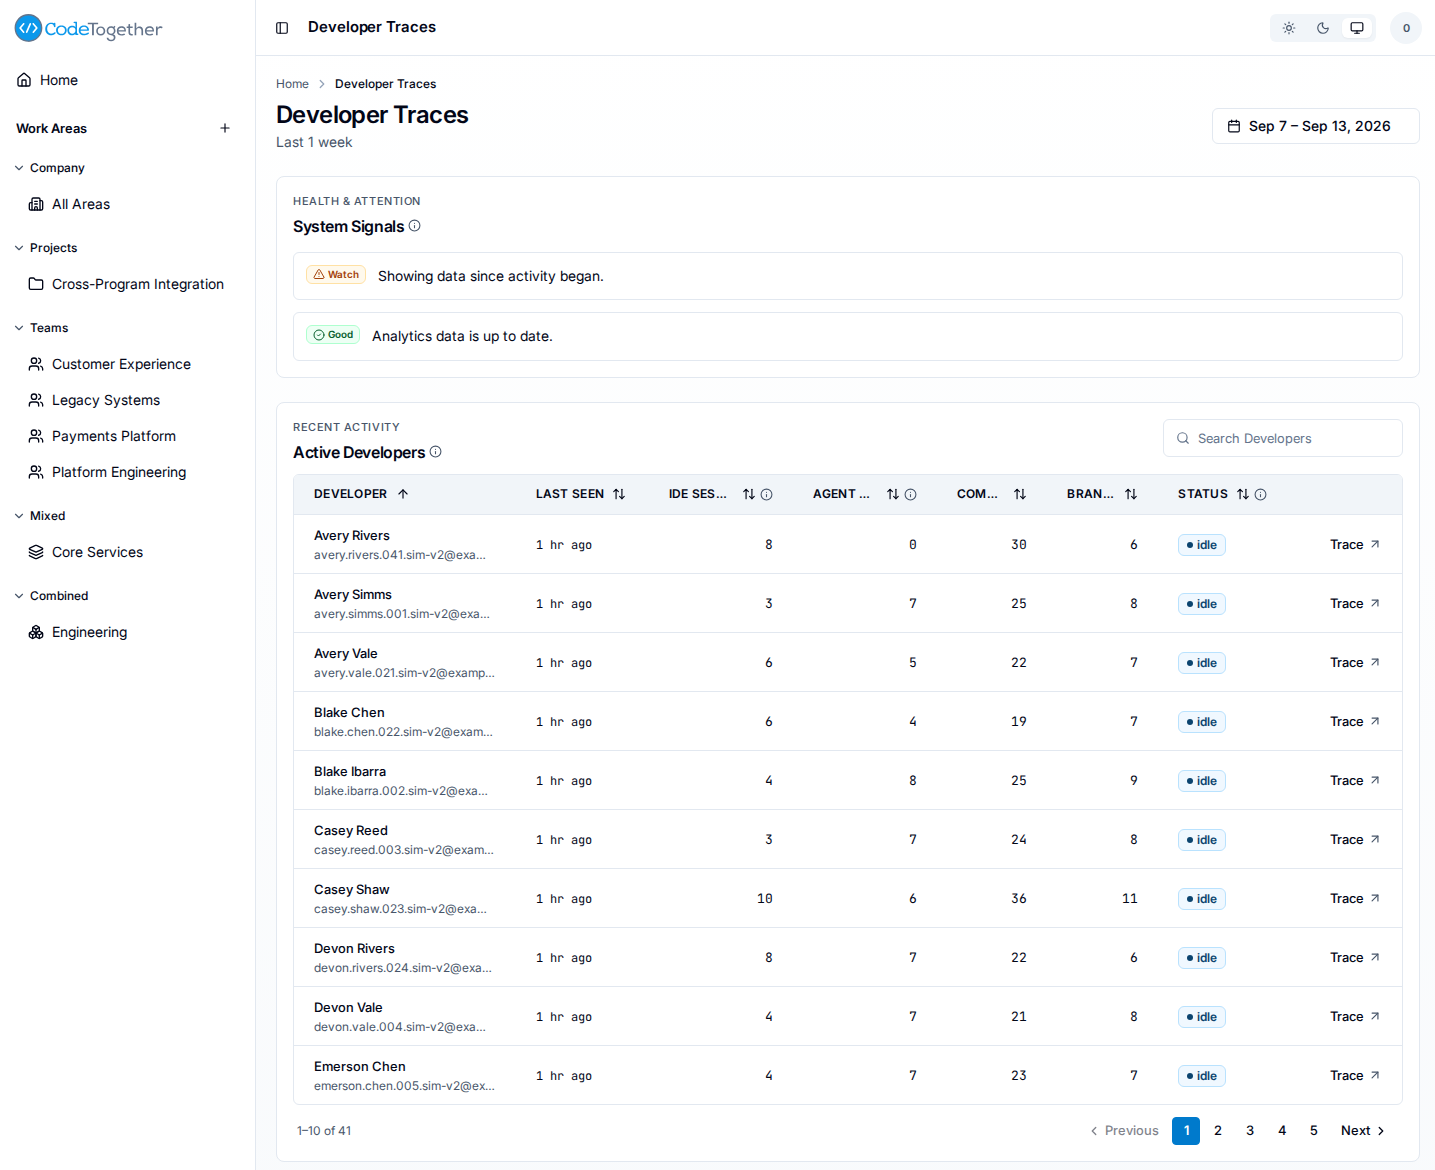
Before reading any numbers, check the System Signals panel under Health & Attention, at the top of the page. It reports how fresh and how complete the analytics behind the page are, which is what explains a number that looks thin. Each row carries a state and a sentence — Good on "Analytics data is up to date.", Watch on "Showing data since activity began." Read the panel first: a flagged row means the numbers you are looking at may still be catching up, not necessarily wrong.
2. Find the developer and period
Search for the developer in the Active Developers roster. Each row shows their session counts (IDE and agent, separately), commit count, active branch count, and a status pill that reflects how recently they were active.
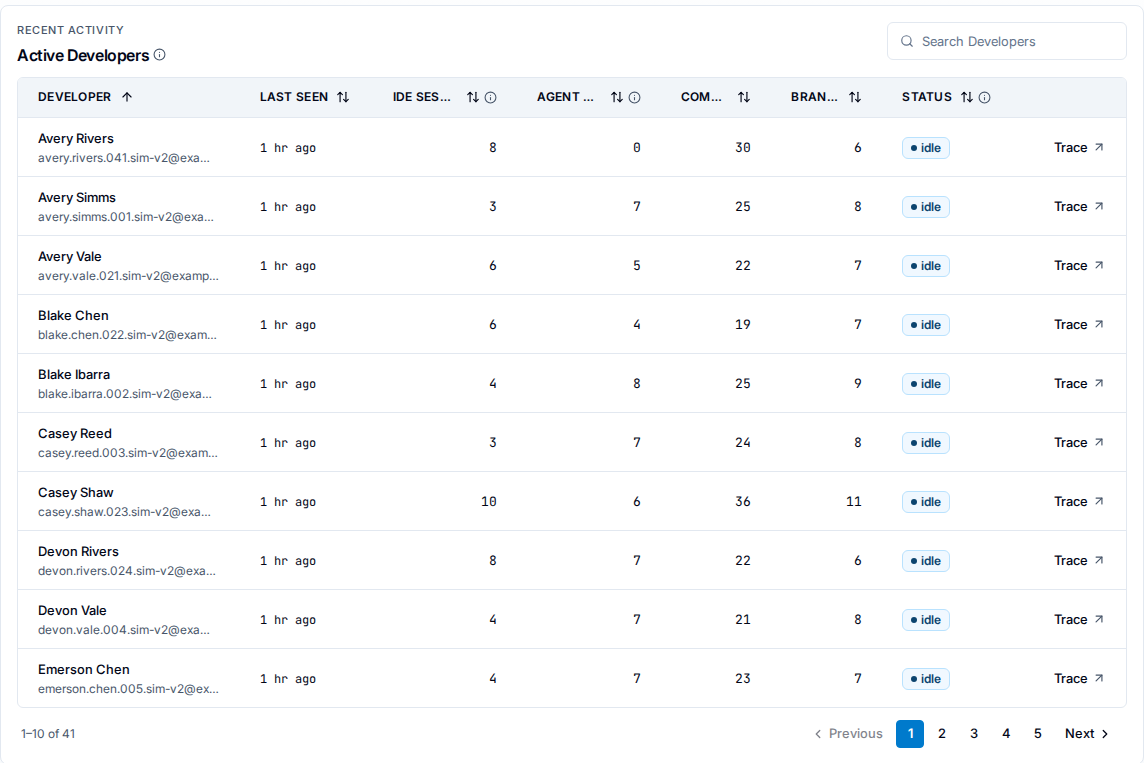
The Status pill answers "when did this last land", not "how much landed": active under 30 minutes, idle 30 minutes to 2 hours, stale 2 hours or more, and unavailable when no activity timestamp exists at all. The info icon on the Status header states the same thresholds. A developer whose commits all arrived this morning reads stale by the afternoon, which is not a fault.
If the developer is not listed, either no activity arrived for them in the current date range, or the period you are checking falls outside it. With a 7-day default, the second is the likelier explanation: adjust the date range at the top right of the page to cover the period in question, then check the roster again before drawing any conclusion.
3. Check the counts and coverage
Select Trace on the developer's row to open their trace. This view shows their work-branch cards and runtime sessions, together with an activity-stream summary that shows how much was captured for the period.
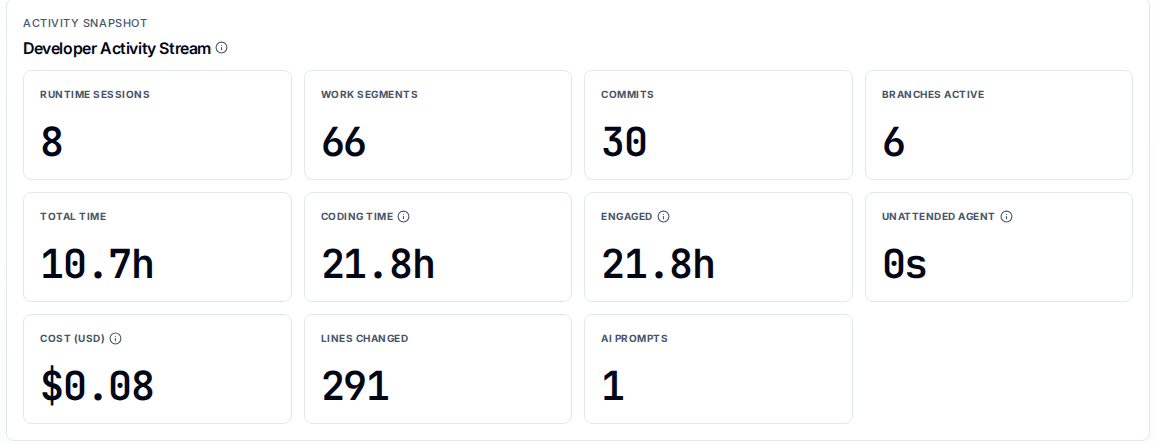
Check the following for the period in question:
- Runtime sessions — IDE and agent sessions, counted together in this summary. The trace then splits into two tabs: Work Branches breaks sessions out per branch on each card's Sessions row, and Runtime Sessions lists every session on its own. An IDE-only developer legitimately has 0 agent sessions; that is not a gap.
- Commits — commits attributed to this developer in the period.
- Branches active — branches with activity in the period.
- Work segments, Coding time, Engaged and Unattended agent — a finer breakdown of the same captured work. Treat them as context for the counts above rather than as the check itself.
- Total time, cost, lines changed, AI prompts — the honesty conventions under How to read the numbers apply: a genuine
0is not a missing measurement. A work branch's own detail view breaks capture down further per branch — see Validate data with developer traces.
Open the Runtime Sessions tab when you need to know how the data arrived rather than how much. Its Source column reads CT for an older client reporting before native reporting existed, Native OTEL for a session the AI tool reported live itself, Harvested for one estimated afterwards from local usage data, and Both when native and harvested data are both present.
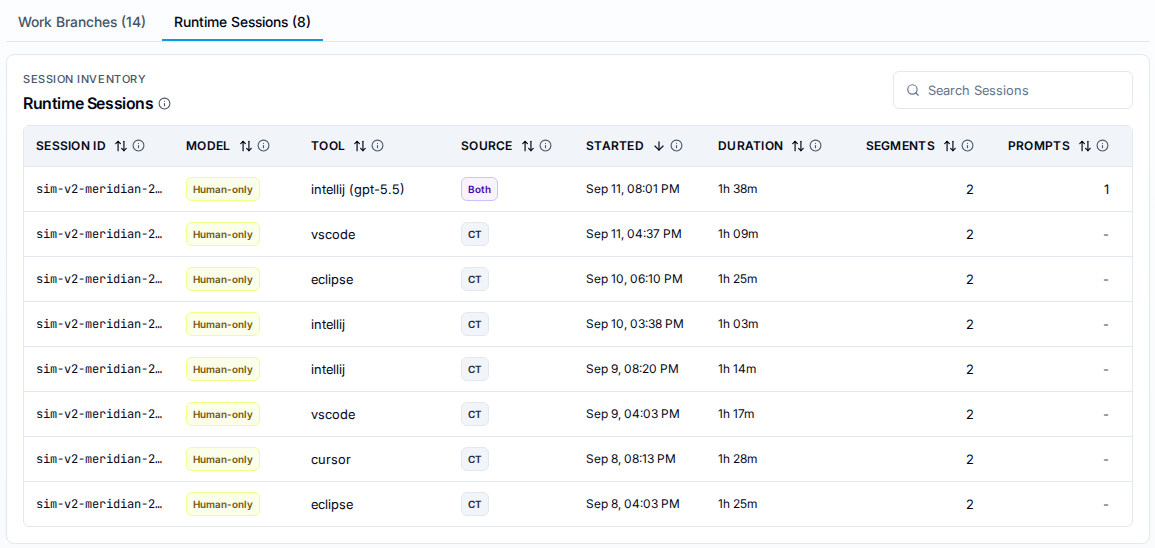
A developer whose sessions all read Harvested is being counted, but from local usage data collected after the fact rather than from the tool's own live reporting — worth knowing before you treat their timings as precise.
If expected activity is missing, work through the following sections before escalating.
How to read the numbers
The product follows strict honesty conventions. Read these before treating any value as a fault:
| What you see | What it means |
|---|---|
0 | A measured zero — the tracker ran and found nothing for this cell. |
| A blank | Not captured — no measurement exists at all. |
| An empty list | Measured, and none found — the list is real; it is just empty. |
A dash (-) in a table cell | How a table renders a blank — no measurement for that cell. Read it as a blank, not a zero. |
| Unavailable on an analysis tile | The AI review has not run yet — the value is withheld, not zero. |
The distinction between a blank and a zero is the most important one. A zero means data arrived and the value happened to be zero. A blank means no data arrived. A blank is the signal that requires follow-up. One further convention applies to attribution: unattributed work is left unattributed, not guessed — see Validate data with developer traces.
Check data quality before investigating
Before assuming a gap is a bug, check the System Signals panel. Each signal names its own cause plainly — read the message rather than assuming a gap is a bug.
Analytics freshness — a row reading "Analytics data is up to date." means the analytics behind this page have been rebuilt for the window you are looking at. When it instead reports that the data may be delayed, the numbers are still catching up: allow processing to clear before treating a thin count as a permanent gap.
Coverage — a row reading "Showing data since activity began." means the window you picked reaches further back than this organization's first captured activity, so the earlier part of it is empty by definition rather than by fault. A row reporting no analytics data for the work area yet means the same thing more bluntly.
Per-developer absence — the panel also flags developers whose AI tools are not reporting natively, and developers with no IDE session in the window. Those name the developer, which makes them the fastest route from "a number looks thin" to the workstation that explains it.
Earlier versions of this page described the panel as carrying pipeline-lag, stalled-session, and clock-skew signals. It does not carry any of those, and never has — read the rows it actually shows.
Check Recent problem reports
- Deployment: On-premises
- Role: Owner, Admin
On-premises, open Settings > Data / Maintenance and select the Recent problem reports tab. It lists the problems that trackers and the server itself reported in the retained window, one row per kind of problem, with its Severity, Problem, Source, Activity, Installs, Count, and Last seen. Expand a row to see its last occurrence and the workstations it affected. A category of AI-tool integration health means usage from an AI tool could not be collected on those workstations, which is a direct explanation for a thin count. The tab is shown to Owners and Admins, the roles that can generate a support bundle.
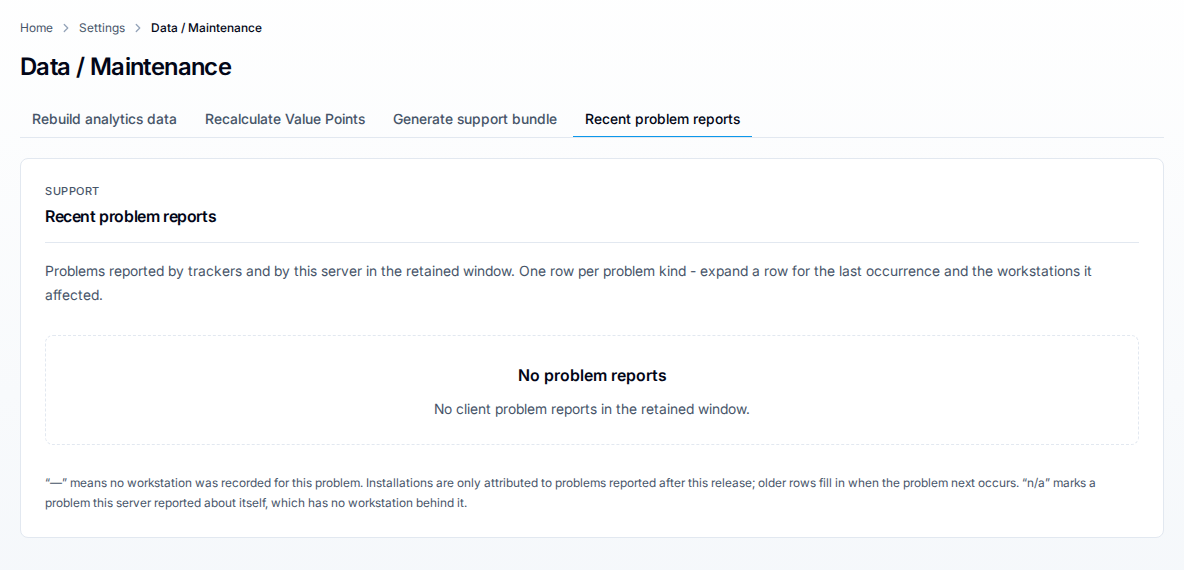
An empty list reads No problem reports, which means no tracker or server reported a problem in the retained window. It does not mean data arrived, so continue with the checks on this page.
When to hand back to the developer
Stop checking server-side and ask the developer to run the client-side diagnostics when any of the following are true:
- The developer does not appear in Recent activity and you have confirmed the period and date range are correct.
- All counts are blank rather than zero — this means no data arrived at all, which points to a workstation configuration issue.
- Every System Signals row reads Good, yet the data is still absent — the problem is at the source, not in the pipeline.
Ask the developer to run the following:
aitrax setup check
If system — see How setup works — reports as configured, then:
aitrax health
The health command produces an offline diagnostic rollup of the shared tracker lifecycle log. For the full developer-side check, see Verify your installation.
For a per-tool view of the same question, a work area's Tracking tab grids every developer against every tool over the last 4 weeks — see No activity appears for a developer.
Related
- Validate data with developer traces — the full drill-down from a dashboard number to the underlying commits, sessions, and analysis facts.
- Verify your installation — the developer-side check when server-side evidence points to the workstation.
- No activity appears for a developer — when a single developer is missing from reports.
- Setup reports not configured — when
aitrax setup checkreports a scope as not configured.