Is the investment paying off?
Usage tells you AI is being used. It does not tell you whether it is paying off. This page is the lens the rest of this section supports: your AI investment on one side, the value your teams actually delivered on the other, and the decision that follows.
- Deployment: SaaS, On-premises
What you are comparing
You invested in AI in particular places — particular tools, teams, or types of work. The question is whether the return showed up where you aimed it.
The comparison has two sides:
- Value output is delivered software, measured in value points. It is read from finished, merged work — not from estimates, not from lines typed, not from time logged.
- Spend is what that output cost: AI token and session cost, plus the engineering labor behind it, priced from the capacity assumptions your admins set — the settings that tell the platform what engineering time costs.
Neither side is useful alone. High output tells you the team is shipping; without the cost, you do not know whether the return justifies the investment. Low cost tells you AI is cheap; without the output, you do not know whether it produced anything.
The three questions
Is it better and faster?
Output per developer is rising, or holding flat, or falling. AI-assisted work produces more output per engineer-week, or it does not. The comparison exposes which is true, and for which people — some developers return several times their own prior rate; others show little change.
Is the cost worth it?
Value per dollar (VP/$) divides output by spend — computed overall, and separately for agentic and in-editor work (see Value points for both). A dollar of AI cost is returning more value than it was last quarter, or it is not. When the number rises, AI is compounding the return on each dollar. When it falls, spend is outpacing output growth. Where AI analysis is unavailable, the platform reports the same figures from output points instead, labeled OP/$.
Is it aligned to your goals?
Not all output is equally valuable. The platform scores business value against a strategic focus prompt you control — the outcomes your organization is trying to move. Work that matches your priorities scores higher than routine dependency bumps or cosmetic changes. If the high-value work is not where the AI investment is concentrated, the spend is misaligned regardless of what the raw output number says.
Business-value scoring against the prompt is most accurate under full-fidelity content analysis, which requires a connected AI analysis provider; on the output-points fallback, scoring relies on size and static signals instead. On SaaS, content analysis is not enabled by default — see Tune value points.
What the comparison exposes
The numbers become actionable when you set them side by side. Two patterns stand out:
- Same output at several times the cost. Agentic work — work done through an AI agent, CLI, or MCP tool — generated a lot of code; most of it did not survive the pull request. AI spend sits on the cost side for that work regardless. The value output is what actually shipped, and it did not rise with the spend.
- Same spend returning several times the output. The same dollar of AI cost, aimed at different work or a different team, returns substantially more. Neither pattern is visible until value is measured separately from spend.
These comparisons also expose what is not returning: spend that went into work that was abandoned, refactored, or never merged. That spend appears on the cost side in full.
The action that follows
The read is a steering signal, not a verdict. Once you can see where value is returning and where it is not, two moves follow:
- Amplify what returns. The tools, people, and work types that produce high VP/$ are worth more investment. The AI adoption report gives the executive read of this pattern across the whole organization.
- Redirect what does not. Low VP/$ in a specific area is a sign to investigate: Is the strategic focus misconfigured for that work? Is AI spend going into exploration that never ships? Is the output high but valued low because the work does not match your priorities? The answer changes what you do next.
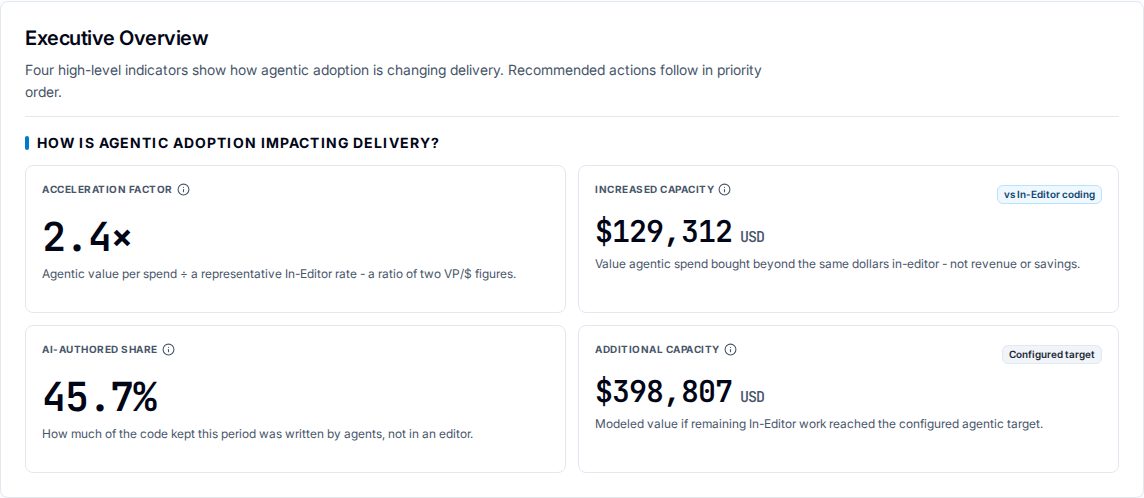
Increased Capacity is a signed difference against the comparison basis named on the tile, so a period that ran below that basis reads as a negative amount rather than zero. AI-Authored Share carries no target, because it describes composition rather than a goal.
The platform gives you the numbers. The decision — where to redirect, what to amplify, and what to stop — belongs to you.
Related
- Value points — the proxy for delivered value output.
- AI adoption report — the executive read of this comparison.
- Tune value points — aligning scoring to your priorities.
- Every pull request has a price — where the underlying data comes from.
- Set capacity assumptions — the cost side of the return read.