Every pull request has a price
CodeTogether AI answers one question the rest of your stack cannot: what each piece of delivered software cost, and what it was worth. This page is the shape of how that works, before any setup detail.
- Deployment: SaaS, On-premises
Why Git history is not enough
When a pull request merges, Git records the final diff. It does not record how many agent sessions ran before a working approach was found, which fraction of the AI spend ended up in the merge, or how much work was abandoned mid-branch. A cost assembled after the fact from Git history understates waste and misattributes spend.
The cost of a pull request can only be assembled where the work happens. CodeTogether AI captures it there — in the IDE, in the terminal, and in the agent session — as the work proceeds, from the moment a branch opens to the moment it closes.
The capture rail
Every pull request passes through the same five stages. CodeTogether AI records the AI spend and human time at each one.
Plan and explore. A developer opens a branch, reads code, and consults an AI assistant. Token spend — the usage AI providers meter and bill by — begins here, before a single line is written. An agent session may open, synthesize context, and close without producing any commit.
Build. The bulk of the work: editing, running agents in loops, iterating. Multiple agent sessions may open and close. Some output gets committed; some gets discarded.
Pull request. The branch is pushed for review. The commit-to-push lag, the review requests, and the follow-up iterations are all observable.
Review. Comments are addressed. More agent sessions may run in response. Spend continues.
Deliver. The branch merges. The final kept work is now known. Value points — the platform's score for the business value of the work that shipped — are assigned against the delivered result.
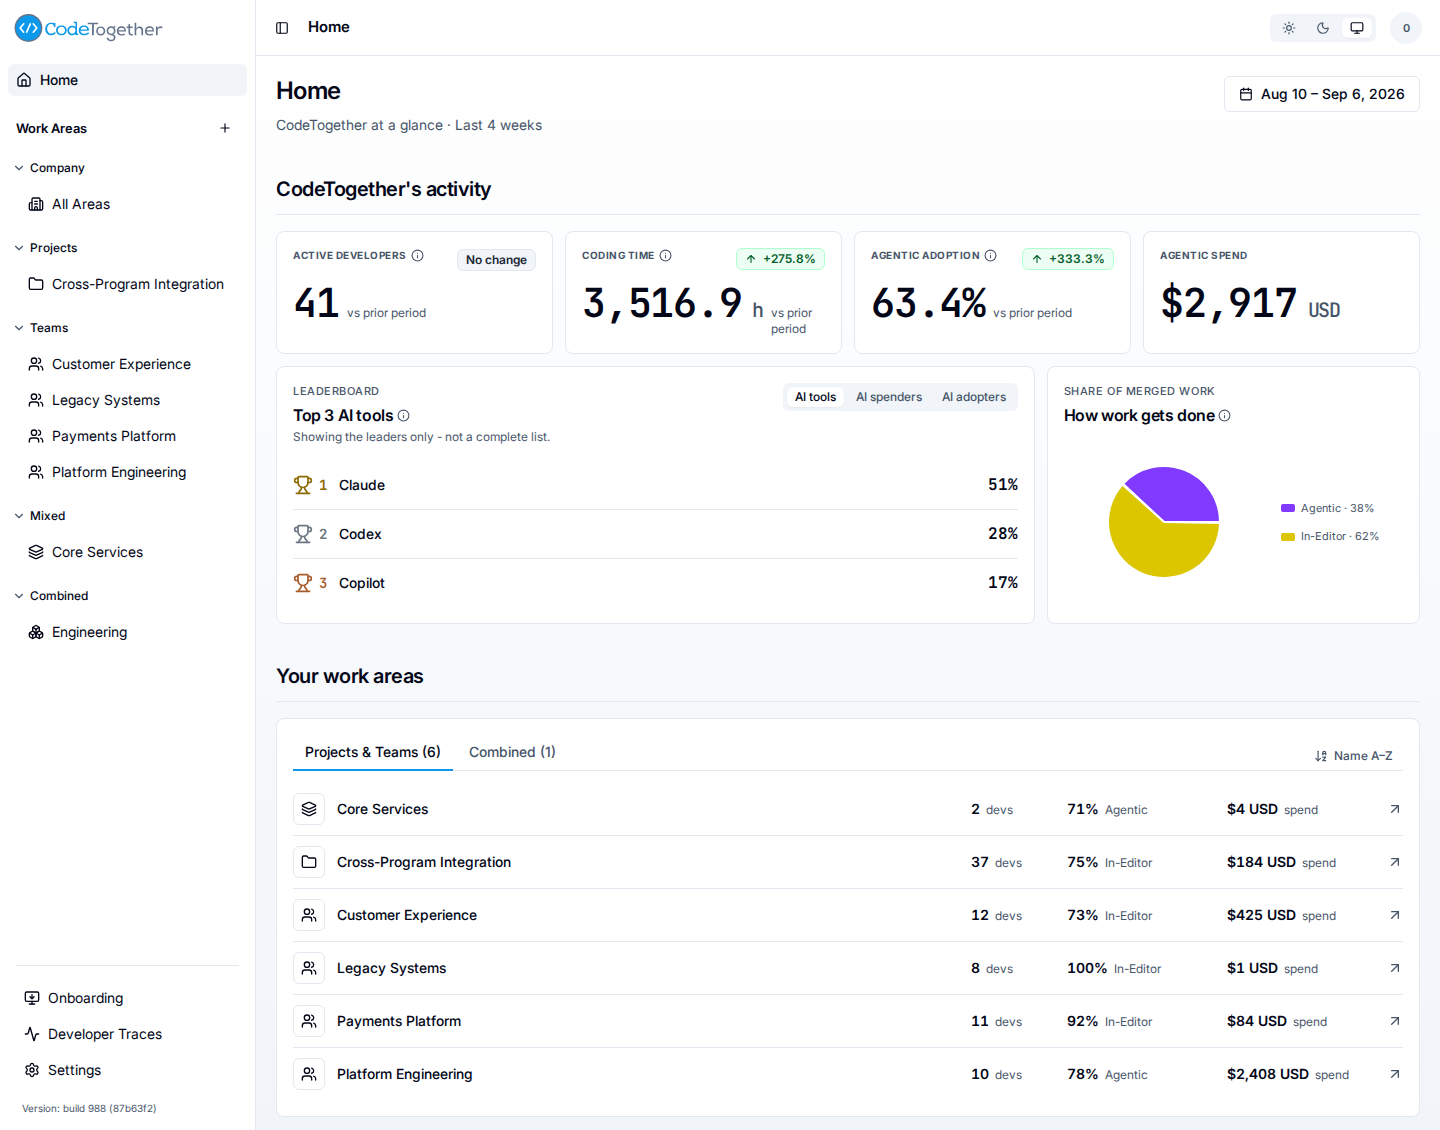
Home is where that record first surfaces for the whole organization: Agentic spend — the cost of every captured AI surface for the period, in-editor assistants included — beside Agentic adoption, the leading AI tools, and one row per work area. For what each figure counts, see the Metrics glossary.
A worked example
Consider a single pull request: "Add OAuth2 PKCE flow."
| Stage | AI spend | Delivered to PR? |
|---|---|---|
| Two Claude Code sessions exploring the auth module | $1.40 | No — abandoned after approach was revised |
| One Codex Cloud autonomous run that scaffolded the auth module | $0.80 | Yes — 62% of the final commit |
| Three in-editor Copilot sessions | $0.30 | Yes — 38% of the final commit |
| Claude Code review session addressing comments | $0.25 | Yes |
| Total AI spend | $2.75 | |
| Spend that reached the PR | $1.35 | 49% |
| Spend that never reached the PR | $1.40 | 51% — flagged as waste |
The numbers here are illustrative. The pattern they show is real: your tool bills record $2.75 in AI spend across the branch — but not that $1.40 of it was consumed on an approach that was discarded before anything committed. The waste is invisible without a system that records spend against delivered work.
The delivered percentages come from attribution the AITrax tracker computes locally on the developer's workstation, relating each session's output to what actually merged. Normal tracking uploads only the derived numbers — see What is captured for the one optional exception. And not every discarded dollar is a defect: exploration is part of engineering. A single abandoned approach is normal; a sustained pattern of spend that never reaches delivery is the start of a conversation, not a verdict.
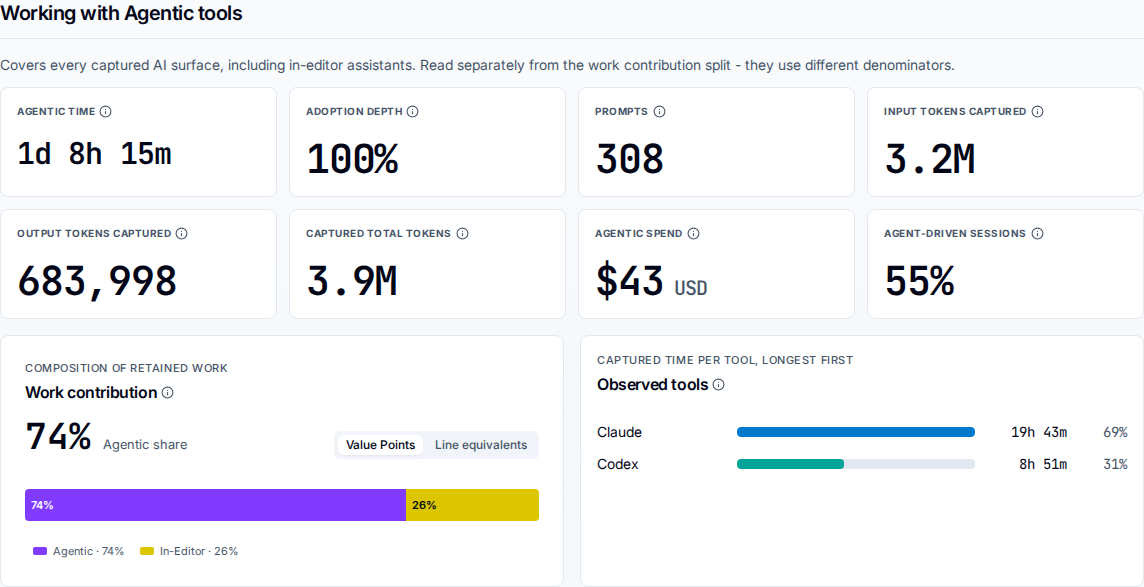
For one developer, the same accounting appears on their profile — opened from a name on a work area's Flow tab — under Working with Agentic tools: agentic spend beside the share of retained work that was agentic, and Observed tools, the captured time per tool. Everything the section reports is a count or a duration — prompts, tokens, time — never the text of a prompt or a completion; see What is captured.
What the analysis surfaces
The per-PR record is useful. The aggregate across weeks and teams is where the patterns appear.
Work dropped on the floor. Branches that consumed AI spend and never merged. The signal is heavy AI spend on a branch that is later abandoned or reverted. This is the cost of a wrong approach, visible early — while it is still a conversation about the approach rather than about a person.
Churn against an inefficient approach. Repeated agent runs on the same branch without commits, or a high volume of review iterations, show where the approach itself was the problem rather than execution.
Patterns producing outsized return. The developers and teams delivering the highest value per dollar are doing something different. The platform surfaces the tools observed, the work-mode split, and the branch patterns behind those numbers — not as a leaderboard, but as the evidence for a coaching conversation.
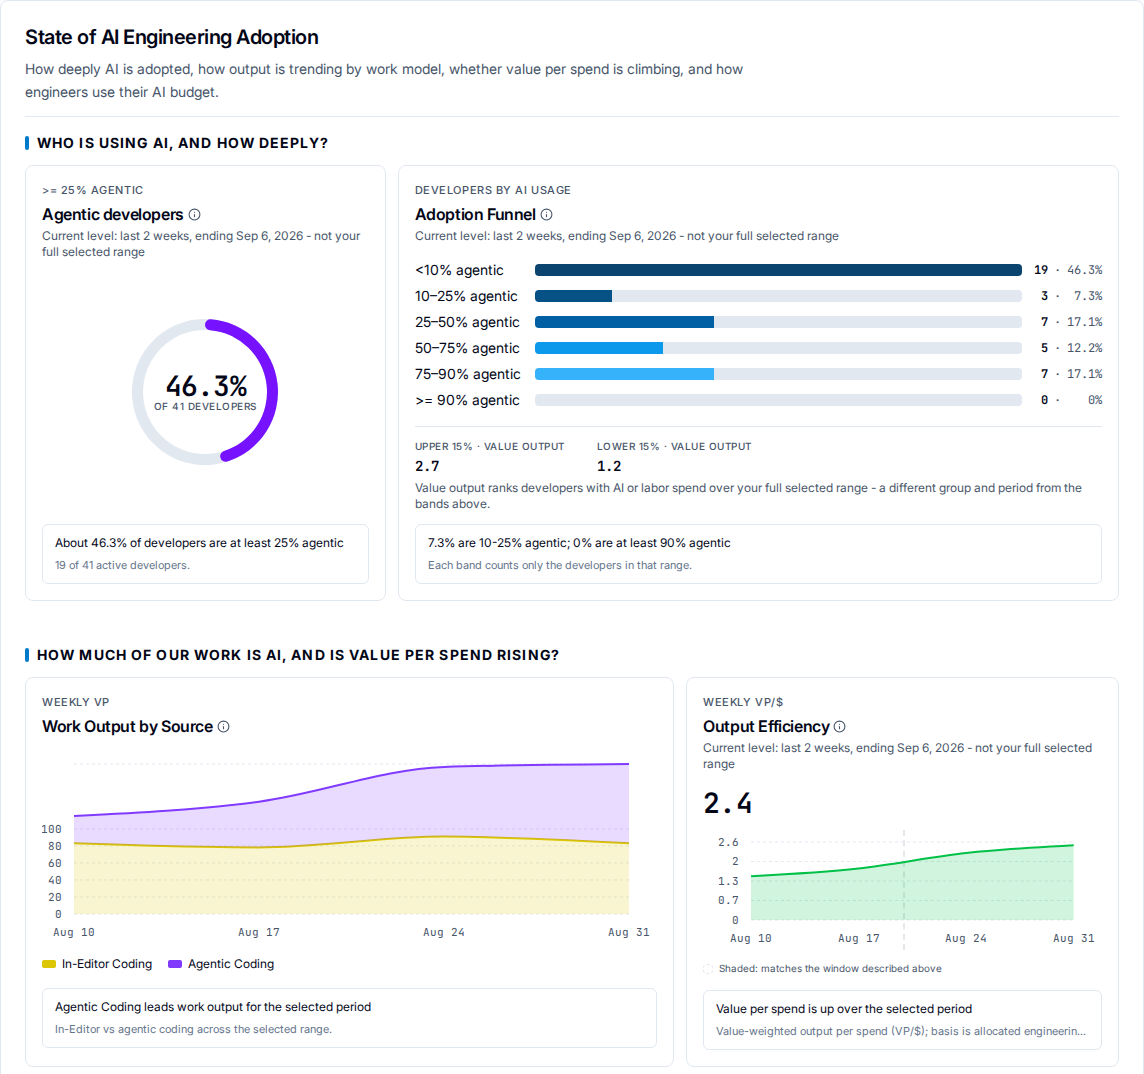
The AI adoption report, on the All Areas scope, reads those aggregates for the organization: how deeply AI is adopted, how work output splits between in-editor and agentic coding, and whether value per spend is rising. It abbreviates value points as VP, and value per spend as VP/$. Each developer is counted in exactly one band of the Adoption Funnel, because the bands do not overlap, and Output Efficiency draws a y-axis, so the trend can be read as a number rather than a direction.
Related
- What is captured — the boundary, and what never leaves your network.
- How tracking works — what runs on a developer's machine.
- Is the investment paying off? — reading spend against delivered value.
- Value points — how delivered work is scored and compared.