Using the Activity Dashboard
The Activity Dashboard provides real-time insights into workflows, efficiency, and team engagement. It offers visibility into engineering activity across multiple levels—company, department, and project. By leveraging AI-powered insights and historical data, teams can optimize workflows, detect inefficiencies, and make informed decisions with confidence.
Key Features of the Activity Dashboard
- Track real-time workflow updates, including coding activity, task completion, and sprint progress.
- Ensure alignment between engineering efforts and company goals.
- Receive AI-powered recommendations for workflow optimization.
- Analyze team engagement, contributions, and potential bottlenecks.
- Integrate with work logs for detailed breakdowns of coding time and task progression.
Accessing the Activity Dashboard
To access the Activity Dashboard:
Open the CodeTogether Portal.
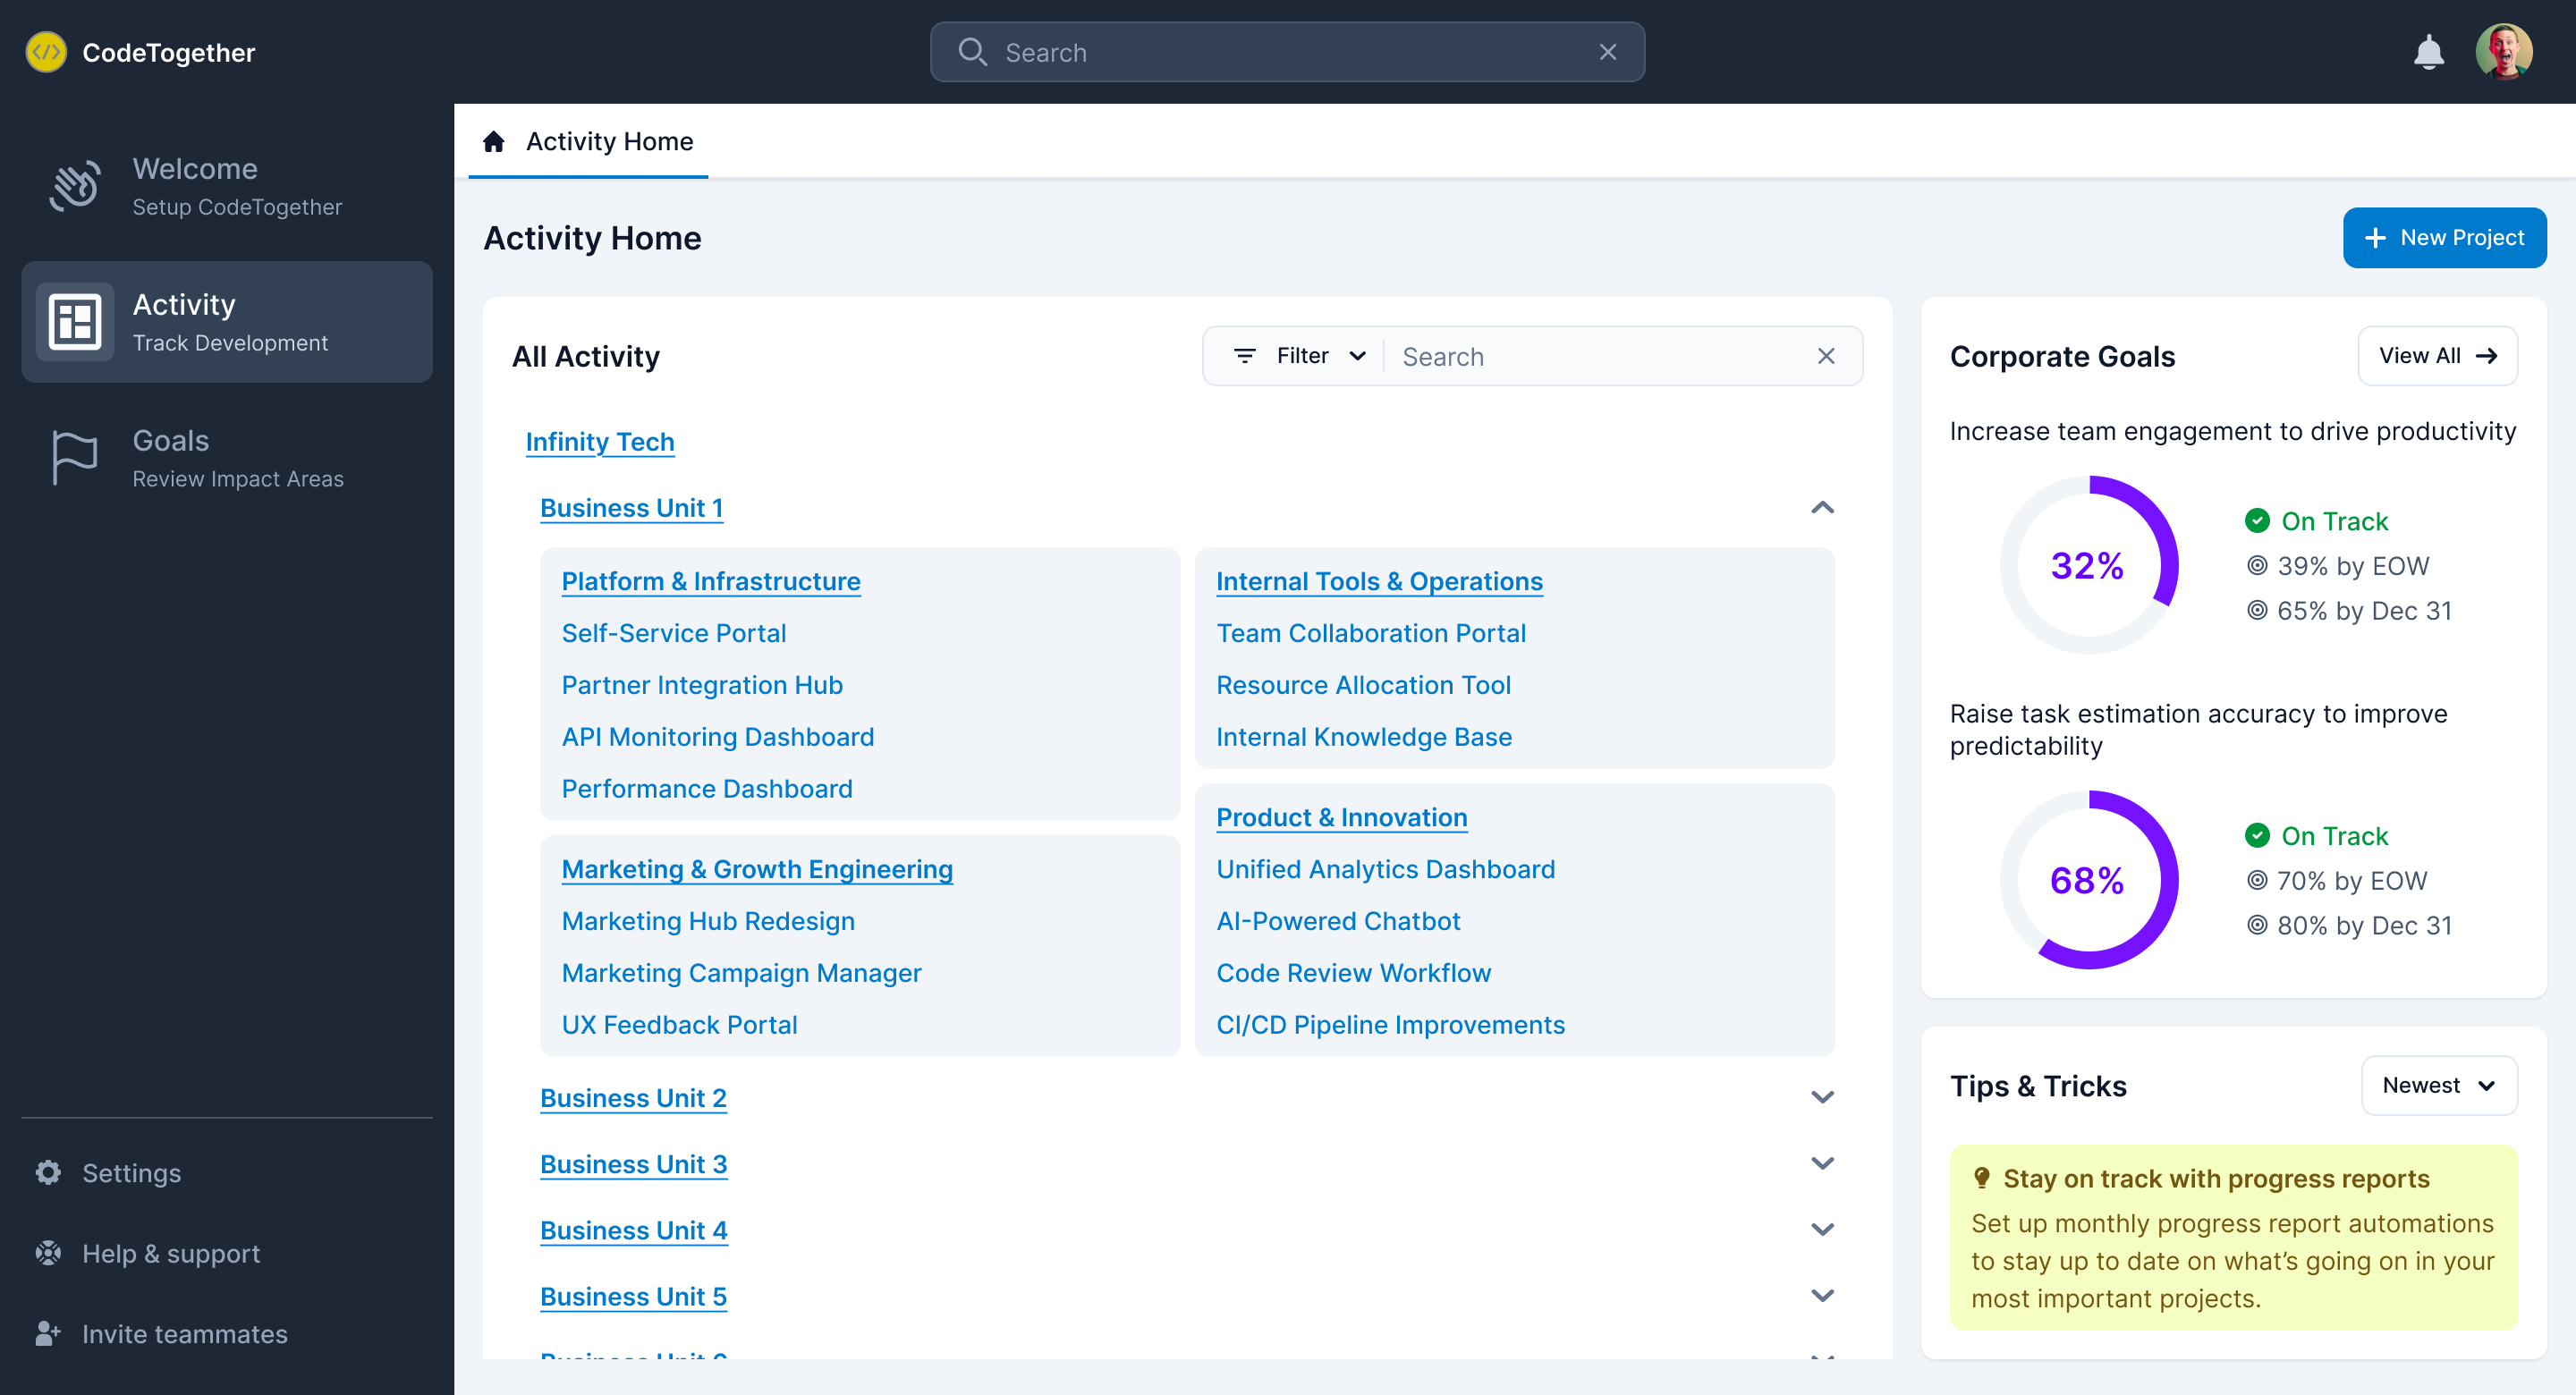
Select Activity from the sidebar to open the Activity Home page. This page provides a navigable hierarchy of the company's departments and projects.
Choose a page from the following levels:
- Company–For organization-wide activity and workflow trends.
- Department–For department-specific engineering activities.
- Project–For project-level insights, including:
- Developer activity
- Task progress
- Sprint status
Understanding the Activity Dashboard
Each Activity Dashboard page—Company, Department, or Project—consists of two main sections:
- Overview Section—Provides a high-level summary, key insights, and recommendations for workflow improvements.
- Activity Section—Offers real-time visibility into ongoing work.
Overview Section
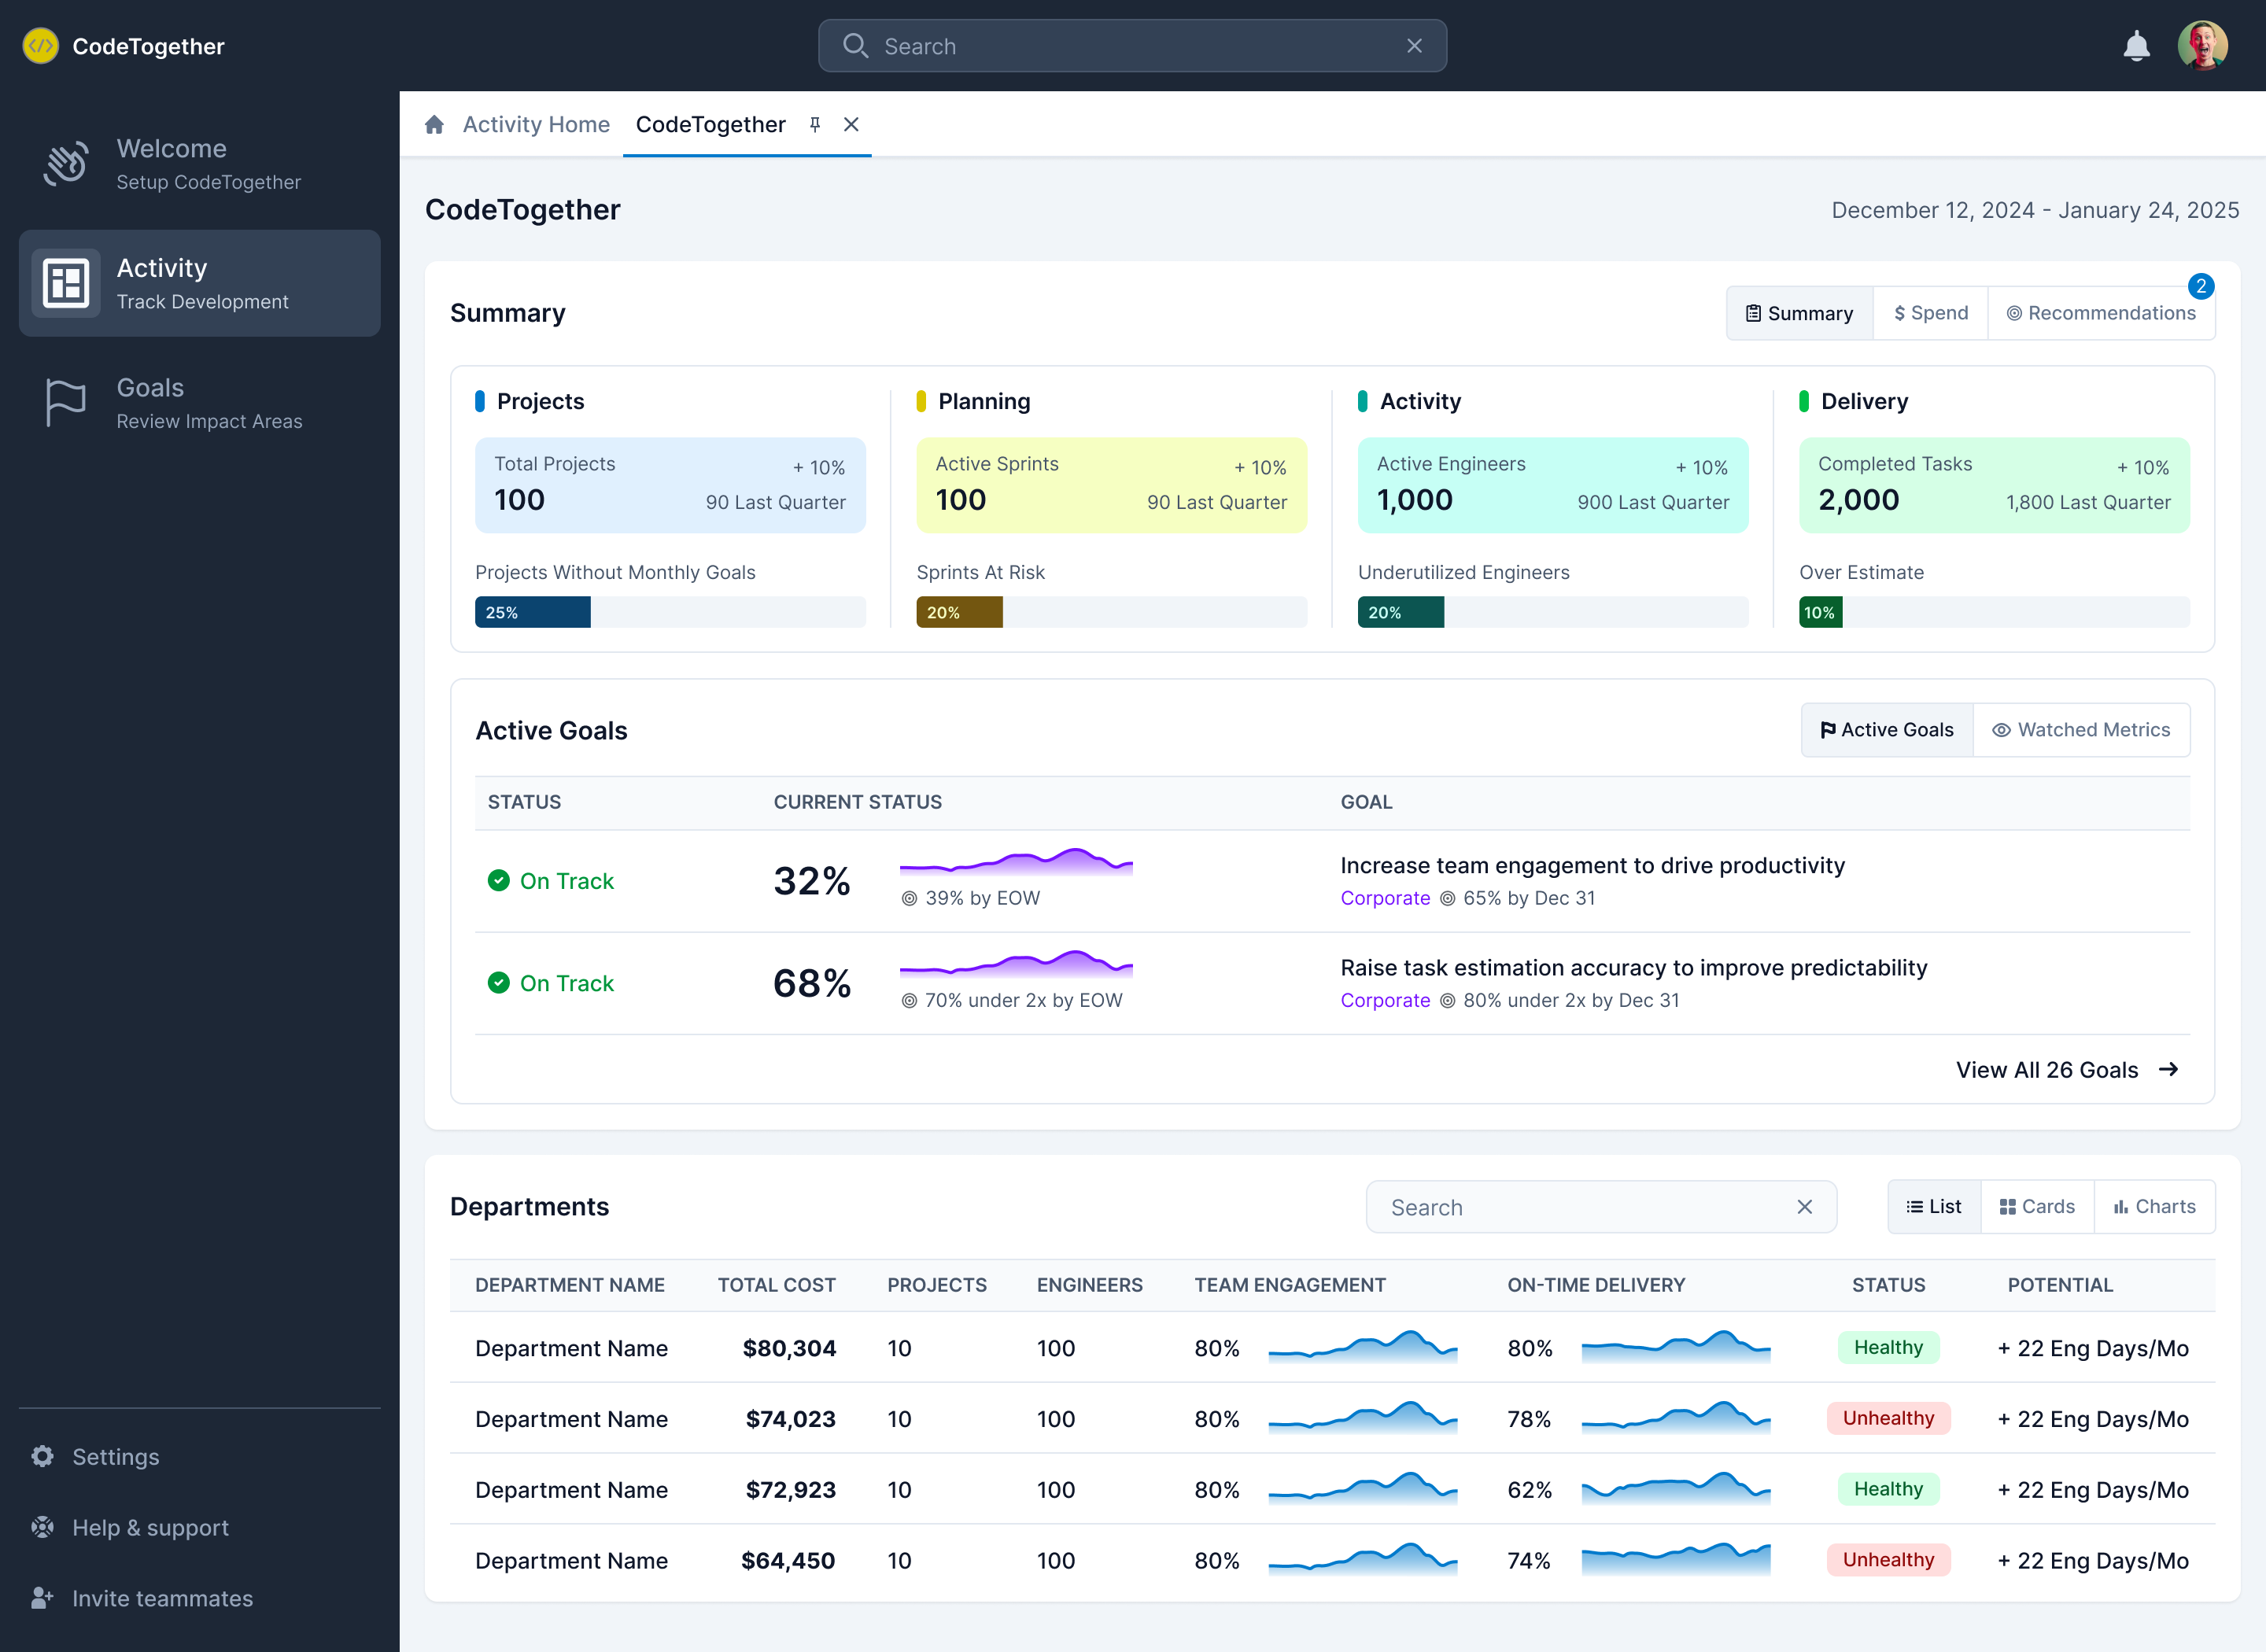
The Overview Section in the Activity Dashboard provides a comprehensive summary of engineering activity, project status, and workflow efficiency. Depending on the selected type of page (Company, Department, or Project), the available insights and tabs may vary.
Summary Tab
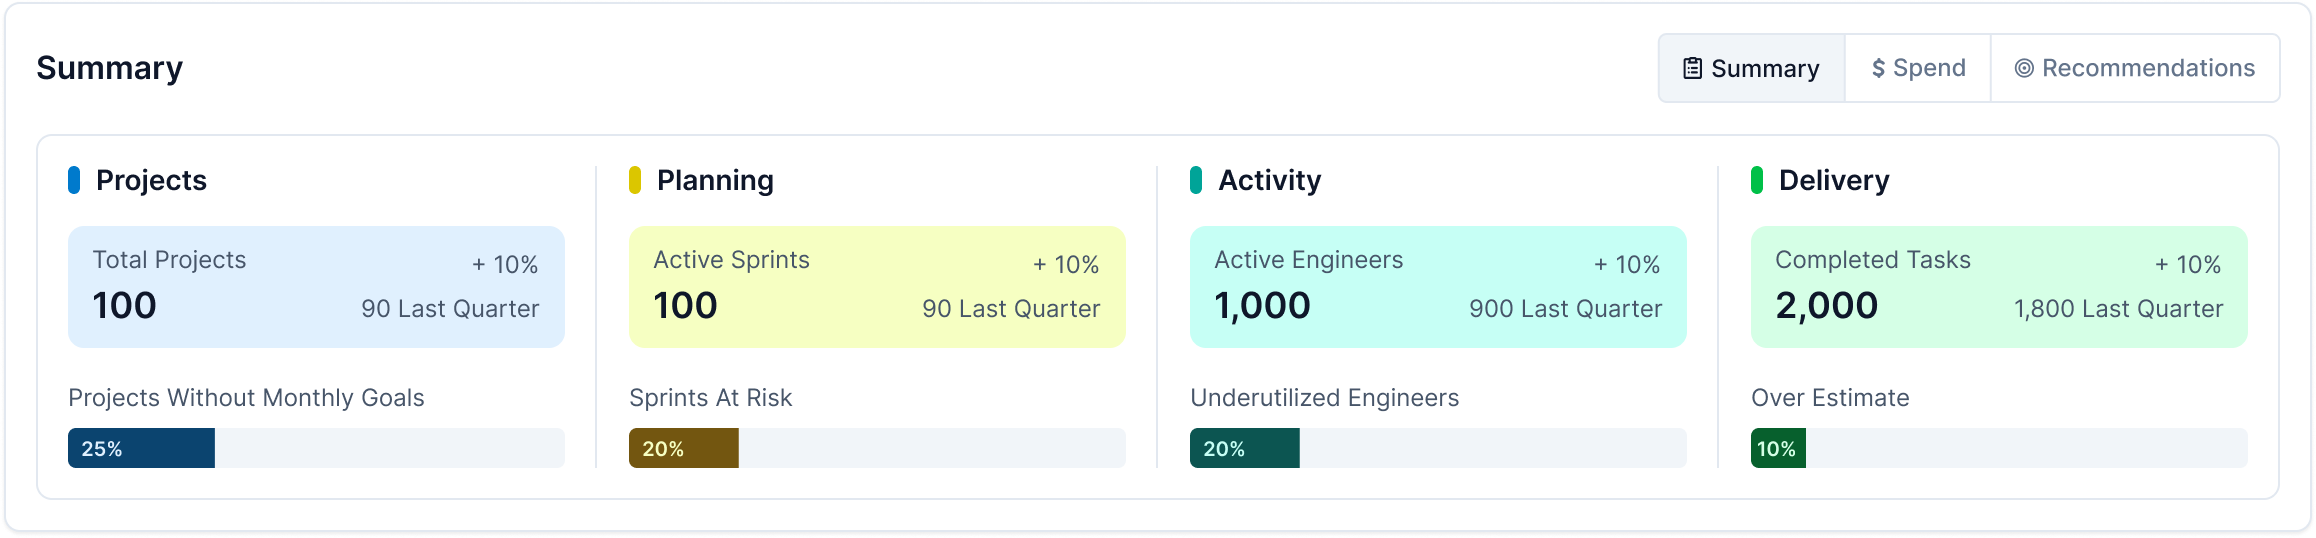
Provides a high-level view of engineering progress and key performance indicators. The first section in this tab is an overview of key metrics. The information shown depends on the selected page type:
Company & Department Pages
Projects—The number of projects that have been active in the last four weeks and the number of projects without goals.
Planning—The number of active iterations and the number at risk of delay.
Activity—The number of active engineers in the last four weeks and underutilized engineers.
Delivery—The number of tasks completed in the last four weeks, along with tasks that exceeded their estimated completion time.
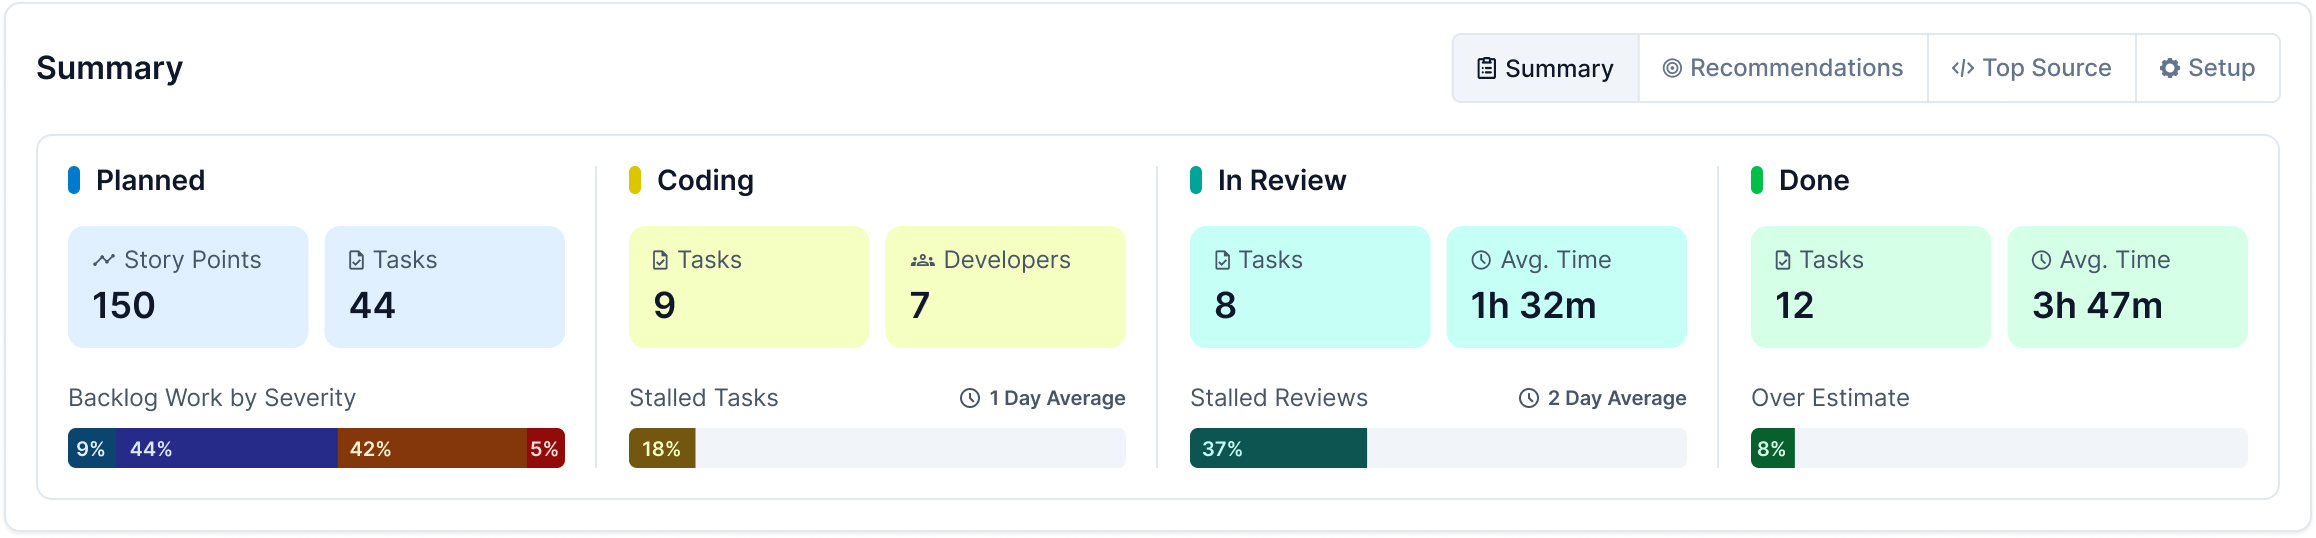
Project Pages
Planned—Scheduled tasks and initiatives that are not yet in development.
Coding—Active development work, including commits, branch activity, and pull requests.
In Review—Code undergoing peer review or QA testing before merging.
Done—Completed tasks, including merged code and finalized project deliverables.
The second section on the Summary tab includes tabs to view Active Goals or Matched Metrics.
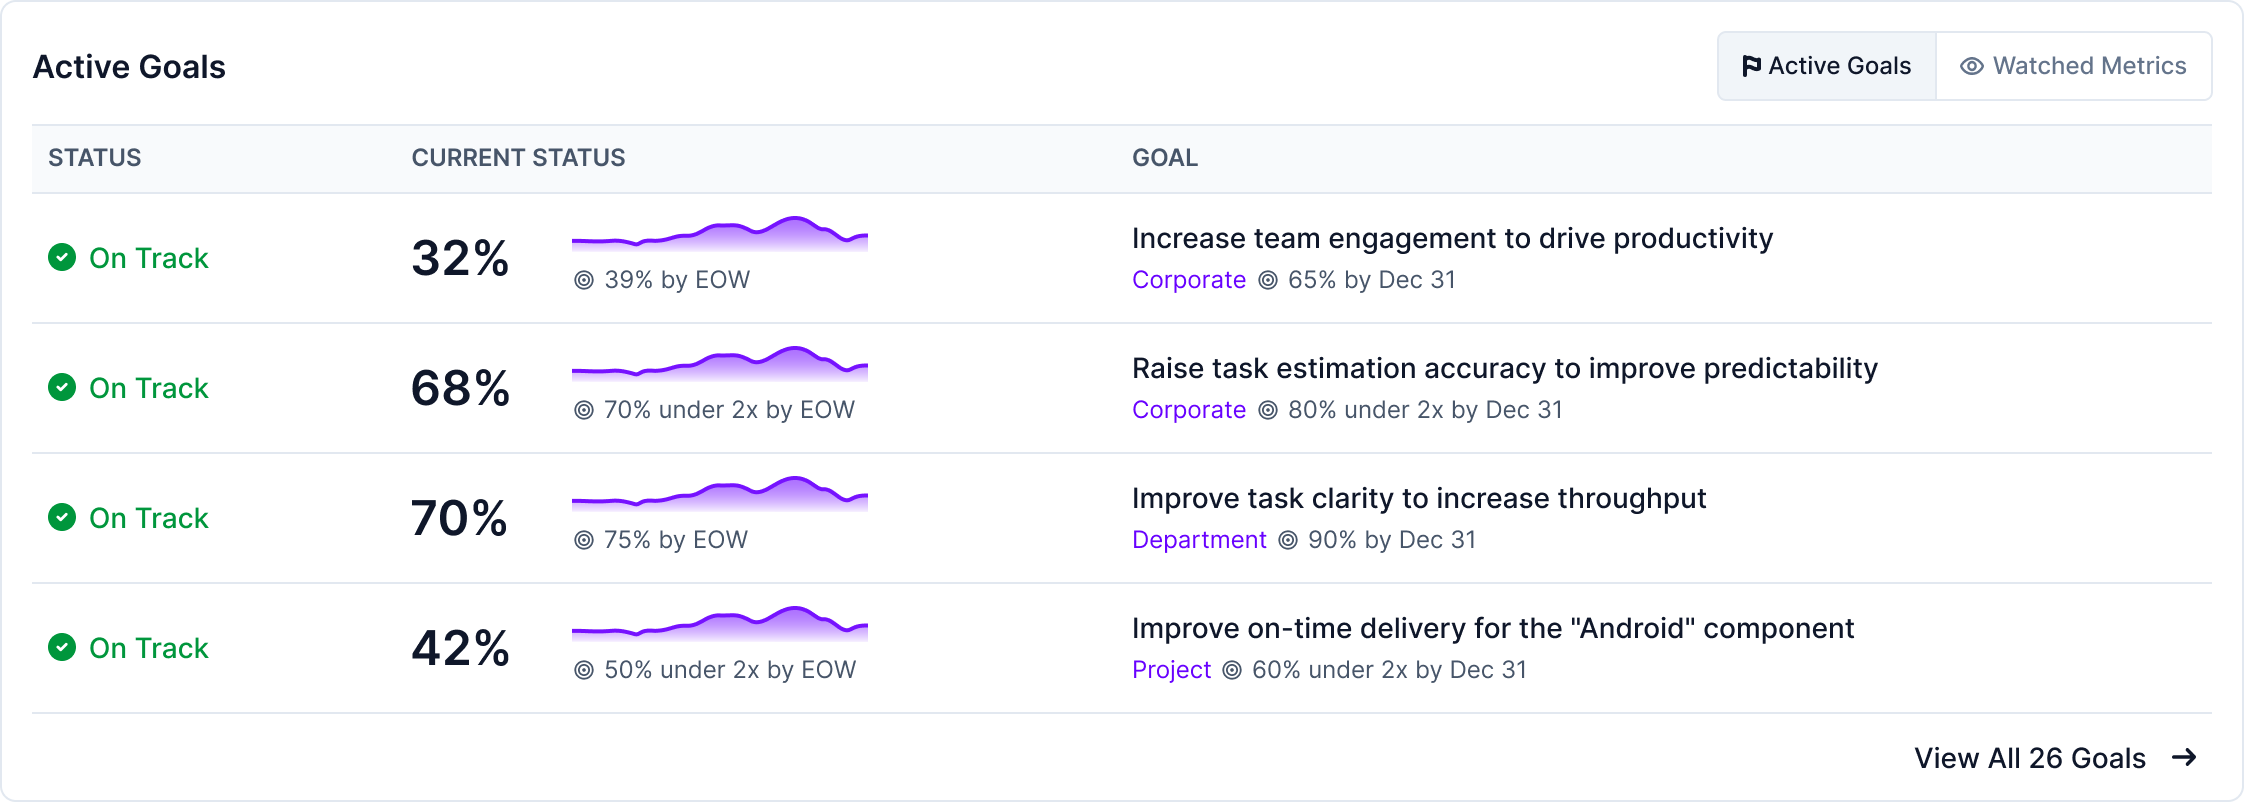
Active Goals Tab
The Active Goals tab (visible only when the Summary tab is selected) displays ongoing engineering goals, tracking progress against company-wide, department-specific, and project-level objectives.
Highlights real-time progress and alignment with strategic priorities.
Provides AI-driven insights on goal achievement likelihood and potential blockers.
- Click a goal to view progress and see a breakdown of tasks affecting goal completion.
Allows users to modify goals based on performance trends.
Click View All Goals to access the Goals Dashboard.
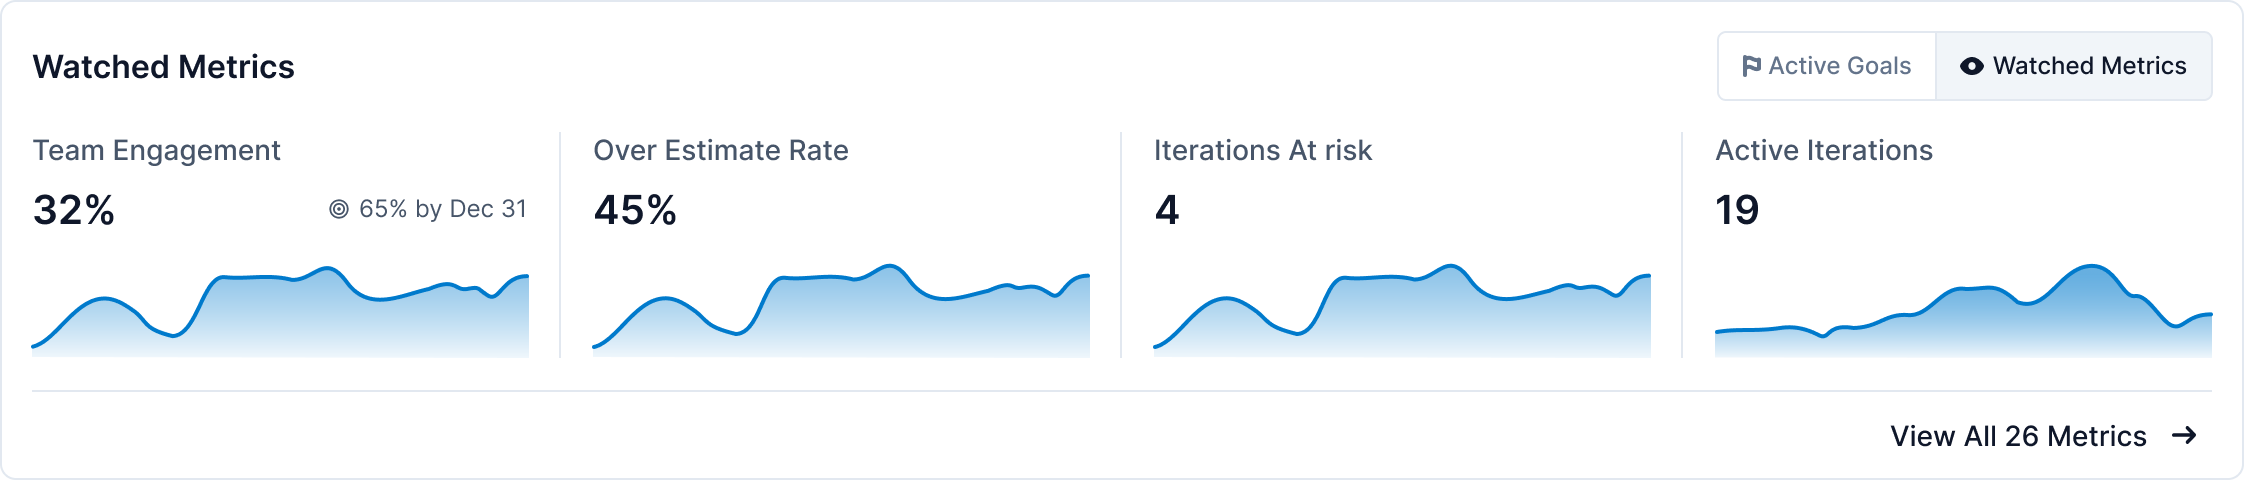
Watched Metrics Tab
The Watched Metrics tab (visible only when the Summary tab is selected) enables users to monitor key performance indicators.
- Displays metrics selected by the user for quick monitoring.
- Supports trend analysis with real-time and historical data.
- Helps teams stay proactive by identifying potential workflow inefficiencies.
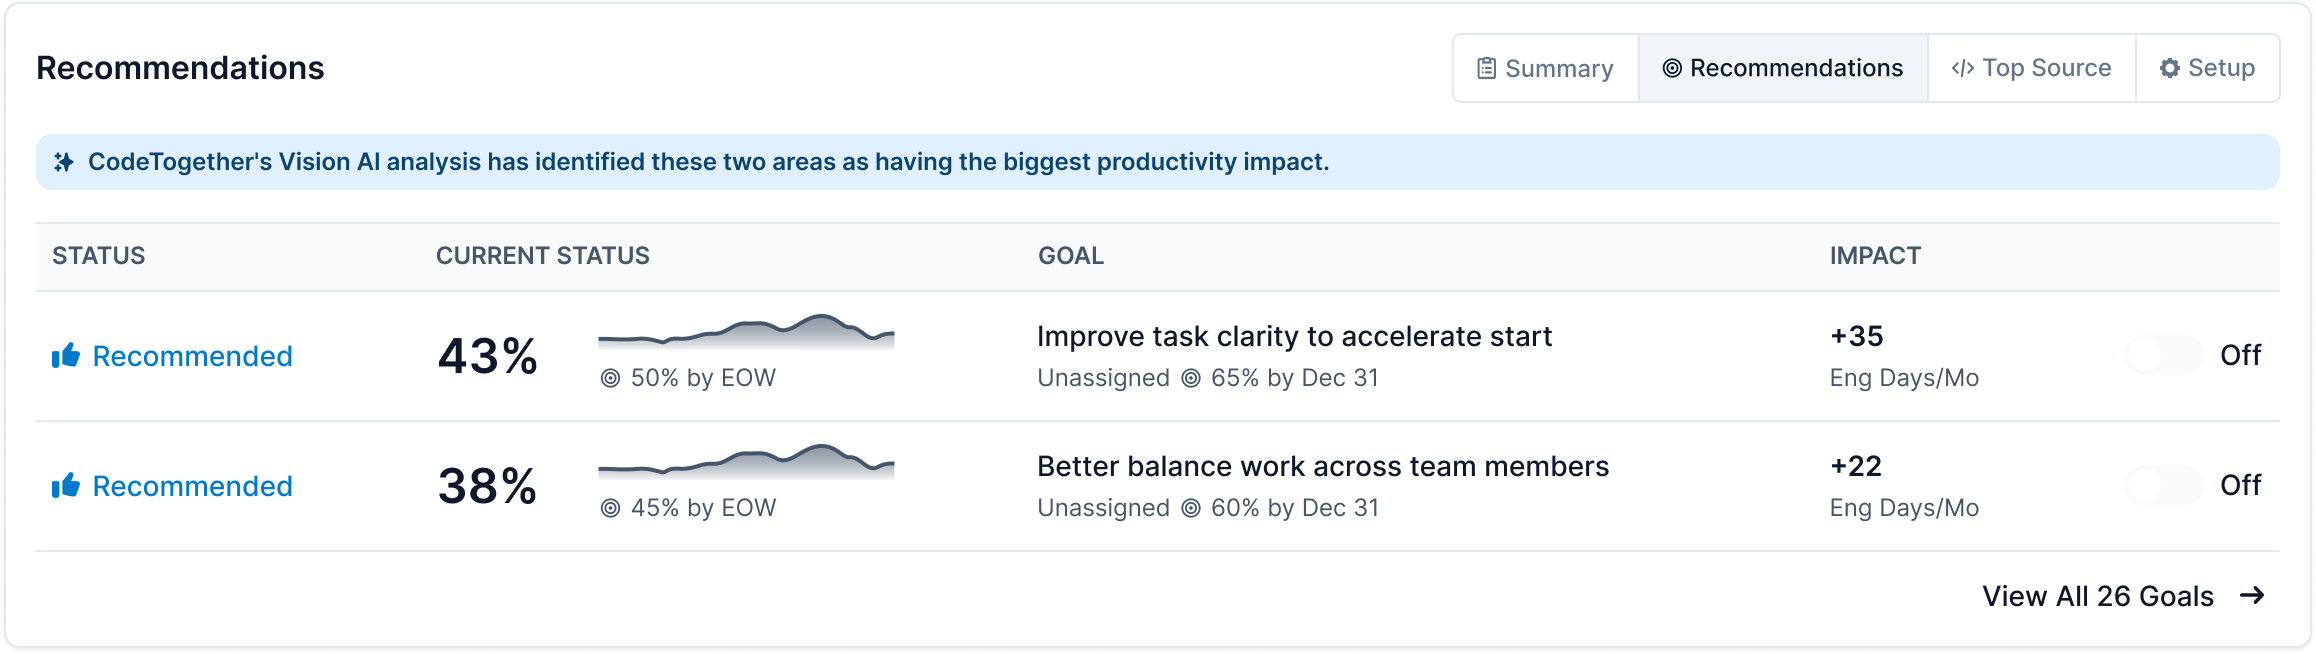
Recommendations Tab
The Recommendations Tab provides AI-powered suggestions to help teams optimize efficiency, meet engineering goals, and improve workflow performance. It identifies high-impact goals based on past trends and team activity, ensuring that engineering efforts are focused where they matter most.
Identify AI-Suggested Goals—View top recommendations tailored to your team’s workflow.
Evaluate the Impact—Each recommendation includes an estimated time-saving value, allowing you to assess its benefits before activation.
Enable Goals Instantly—Simply toggle a recommendation on or off to apply it to your team's tracking system.
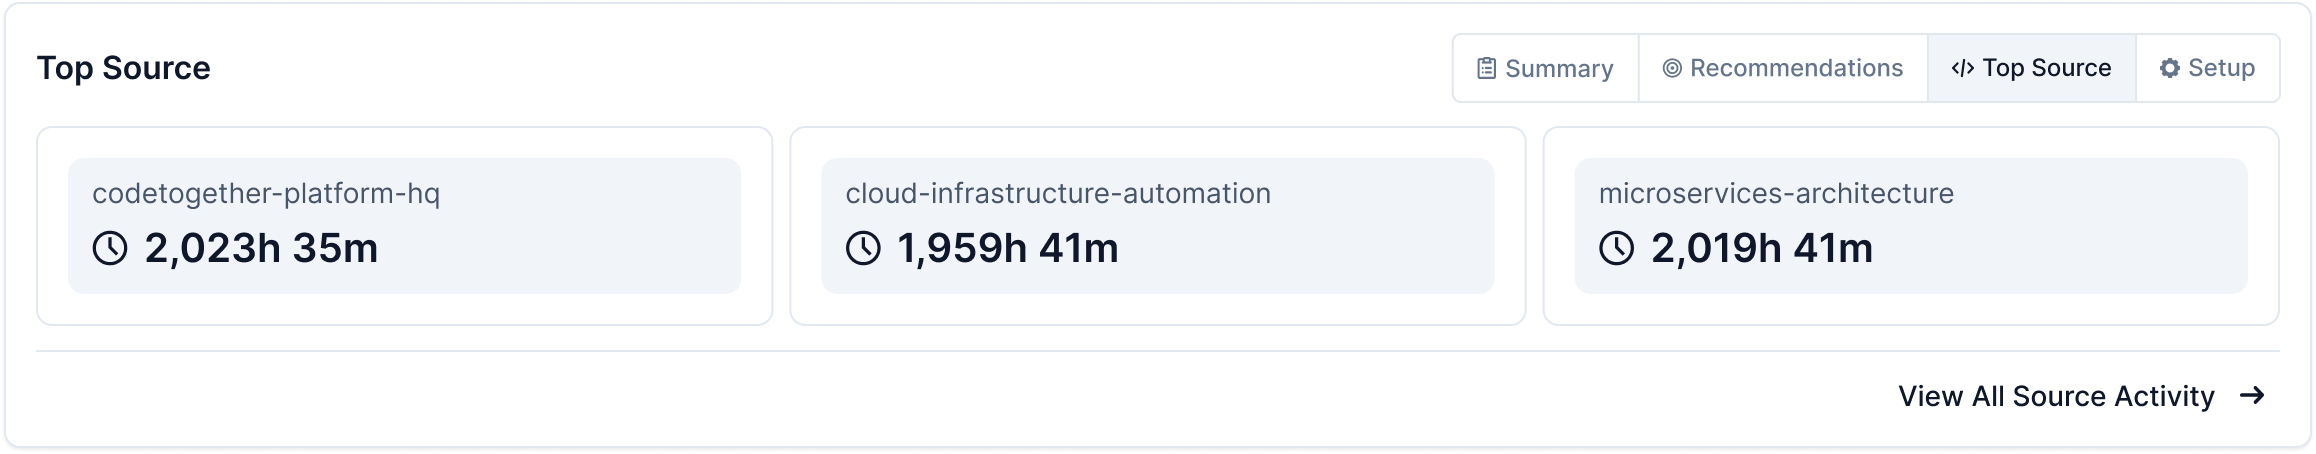
Top Source Tab (Project Pages Only)
The Top Source Tab provides insights into the most active folders, repositories, and components within a selected project. It helps teams quickly identify high-impact areas of development, track engineering effort distribution, and optimize workflows. You can view source activity for a deeper analysis.
To view Source Activity:
- Open a Project page in the Activity Dashboard.
- Select the Top Source tab.
- Click View All Source Activity in the Top Source section.
- Review the bar chart, which highlights the most active components in the project.
- Review the Activity Summary, which includes monthly statistics and development trends for:
- Active Engineers
- Total Engineering Time
- Resolved issues
- Analyze the activity breakdown to see how time was distributed between exploration and actual coding. Use the tabs below to customize the page:
- Tree—Organize activity by file structure.
- Git Repository—View activity within the Git structure.
- Components—Analyze activity based on specific components.
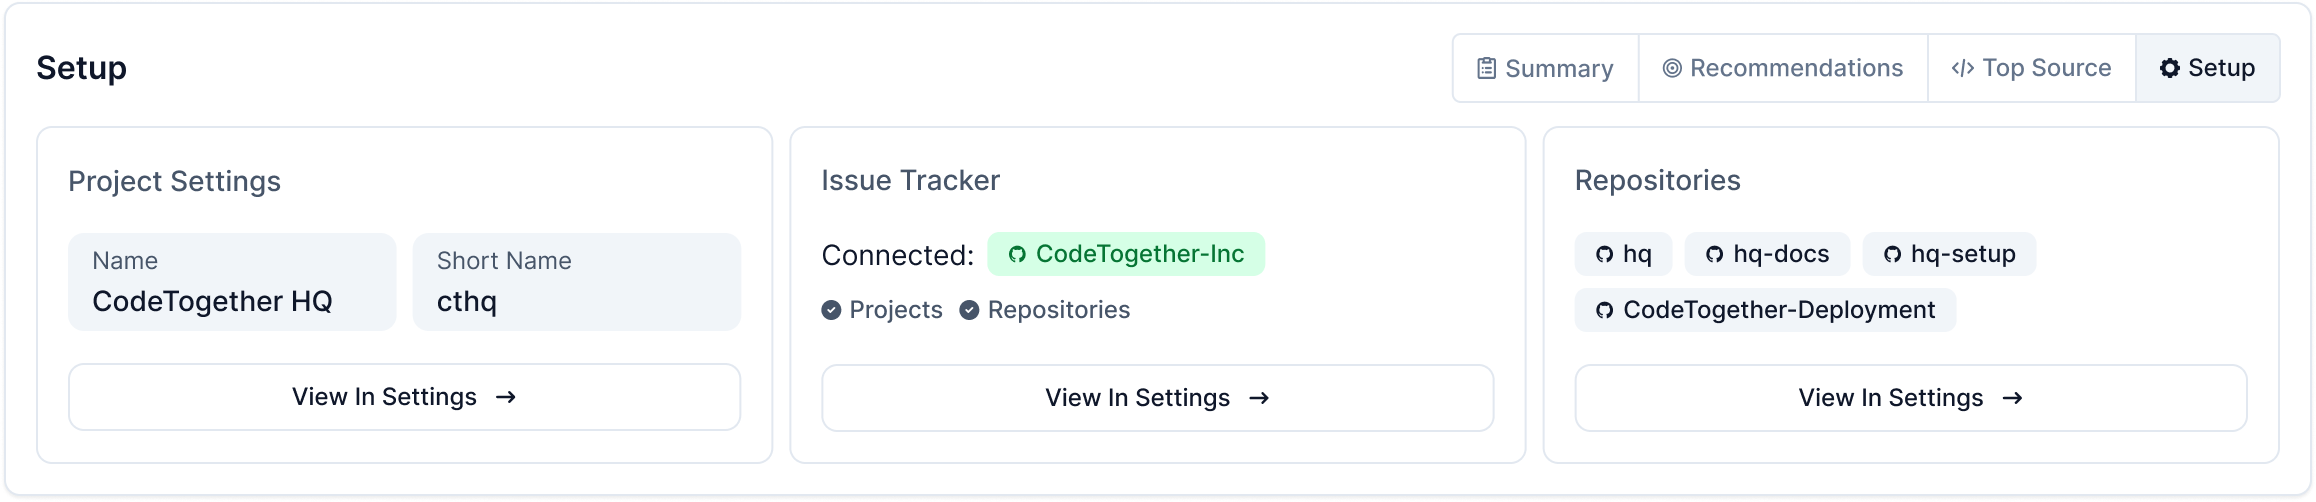
Setup Tab (Project Pages Only)
The Setup tab offers an overview of the project's configuration, including integrations with an issue tracker and repositories. Click View in Settings to access detailed configuration options.
Activity Section
The Activity Section provides real-time tracking of engineering work, allowing teams to view ongoing progress through different visualization formats.
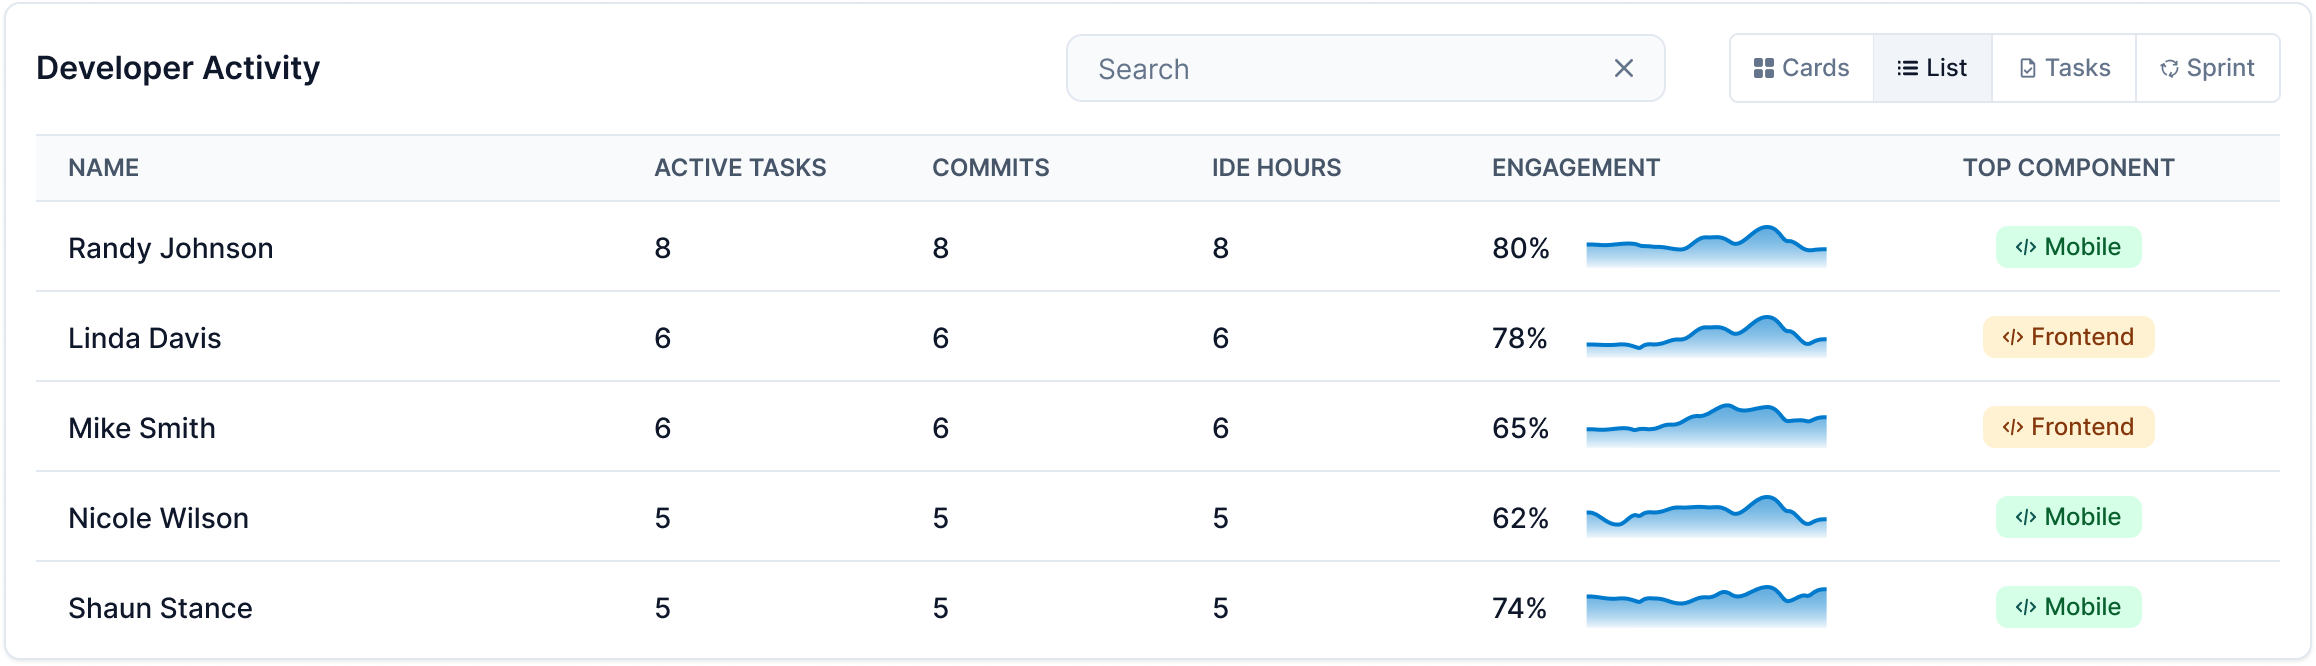
List Tab
The List tab presents a structured, detailed table view of engineering activity. This information depends on the page type as follows:
- Company—Displays the breakdown by department. Includes Engineer Days, Active Engineers, Engagement Rate, and Over Estimate Rate. Click a department to view its activity.
- Department—Displays the breakdown by project. Includes Engineer Days, Active Engineers, Engagement Rate, and Over Estimate Rate. Click a project to view its activity.
- Project—Displays the breakdown by developer. Includes Active Tasks, Finished Tasks, and Engineer Hours. Click a developer's name to view their work log.
Use the Search bar to quickly locate an item.
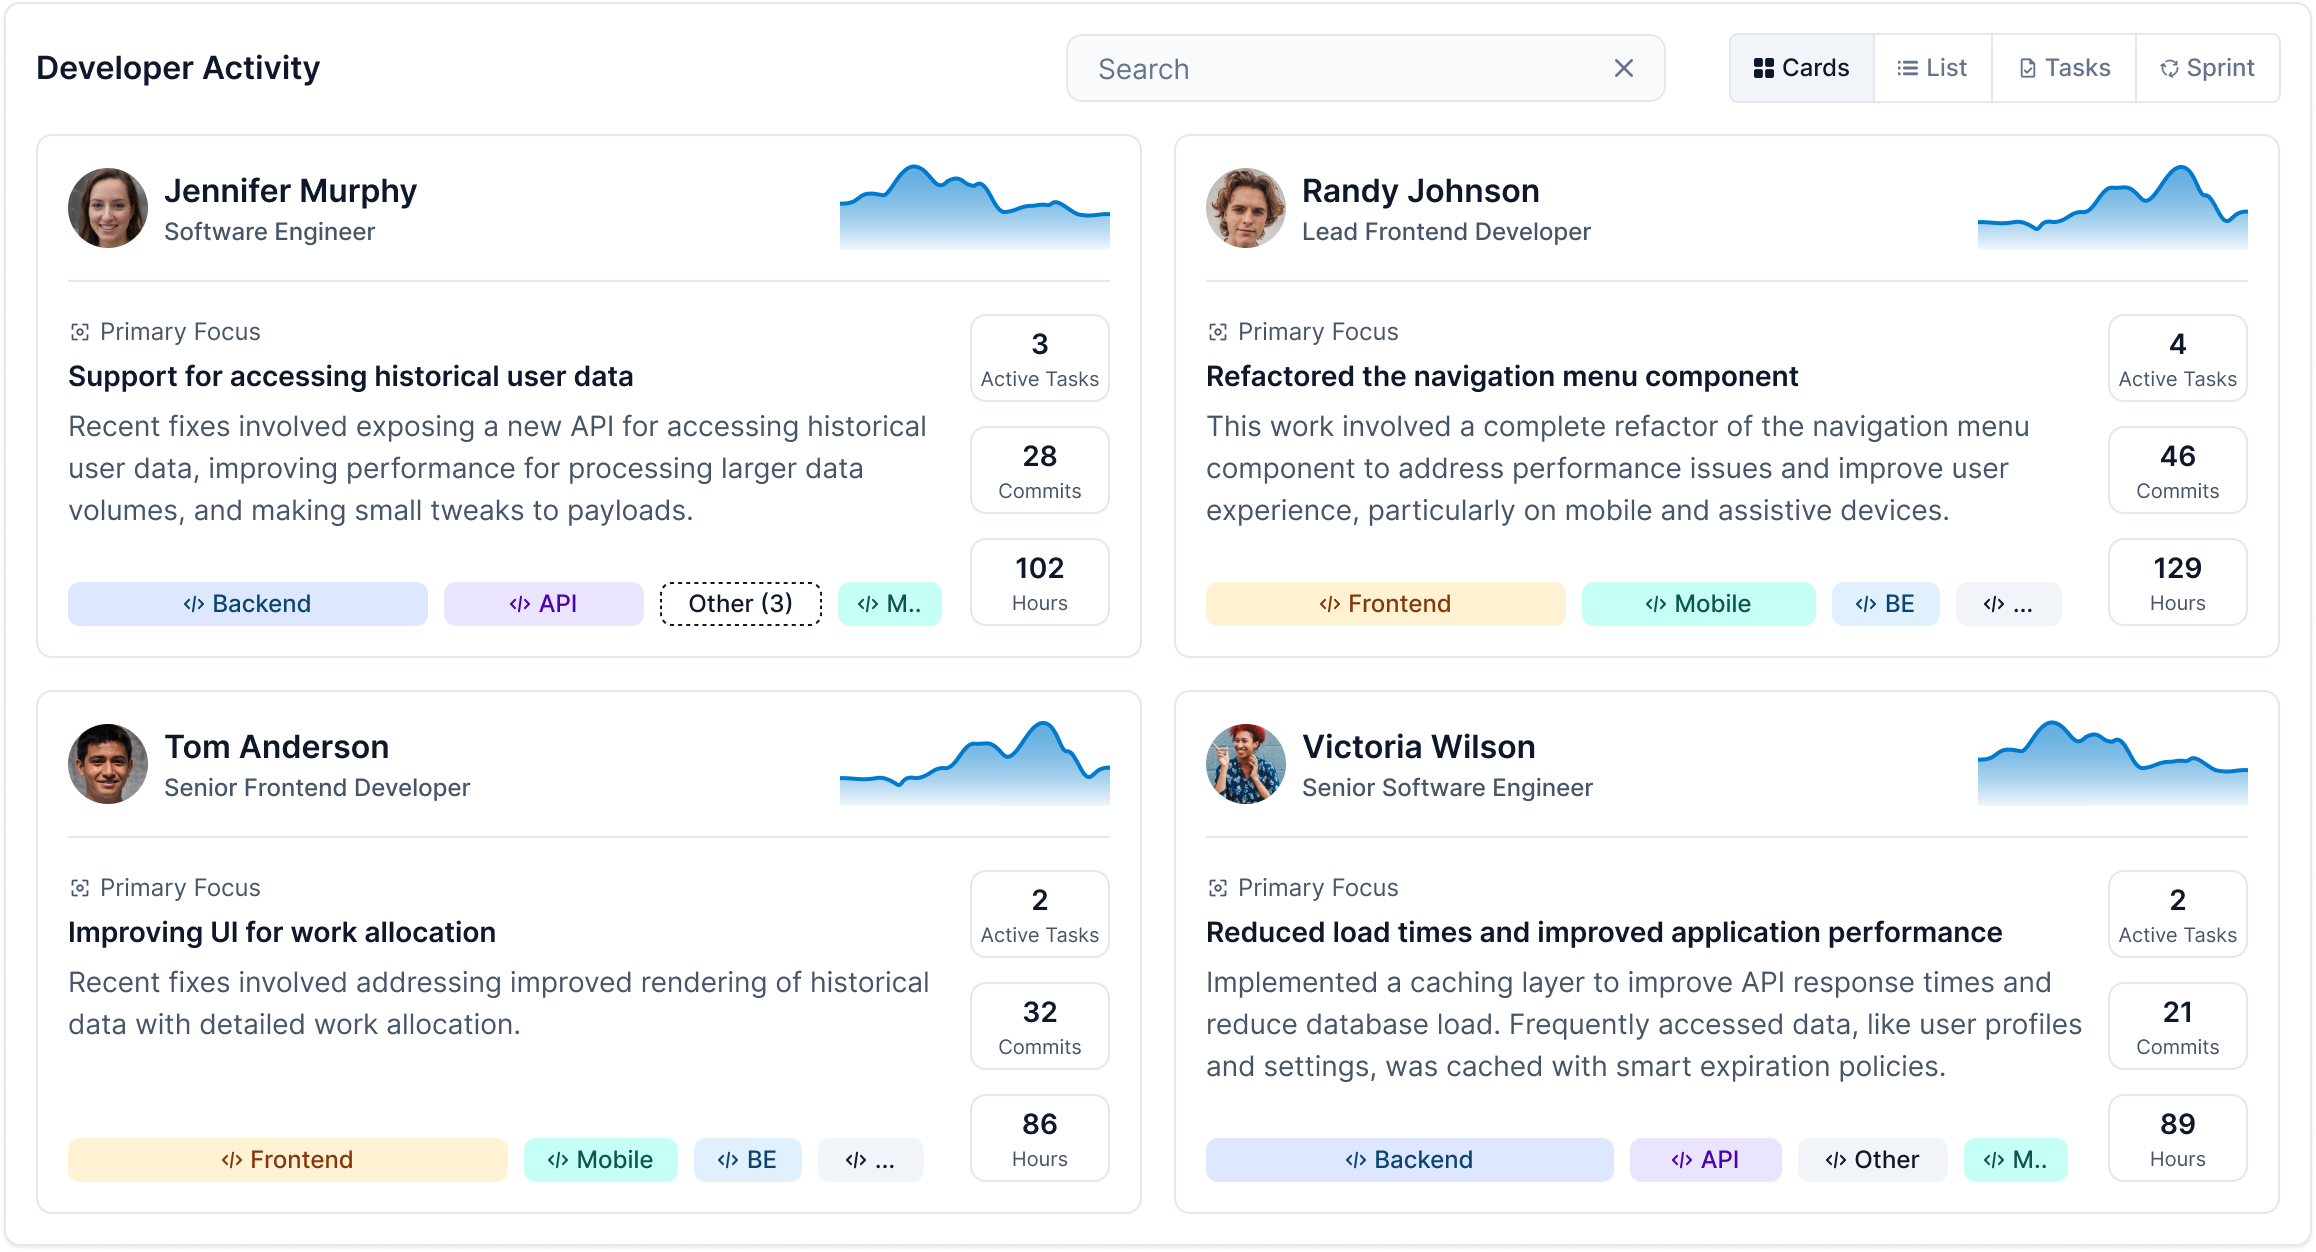
Cards Tab
The Cards tab presents a card grid with engineering activity. Each card includes a graph to easily spot trends, an AI-generated summary of recent activity, and key metrics.
The metrics shown depend on the page type:
- Company—Displays the breakdown by department. Includes Active Engineers, Engagement Rate, and Engineer Days. Click a department to view its activity.
- Department—Displays the breakdown by project. Includes Active Engineers, Engagement Rate, and Engineer Days. Click a project to view its activity.
- Project—Displays the breakdown by developer. Includes Active Tasks, Finished Tasks, and Engineer Hours. Click a developer's name to view their work log.
Additionally, when viewing Company or Department pages, a status indicator shows goal progress. On Project pages, the dashboard displays a visual representation of the component workload.
Use the Search bar to quickly locate an item.
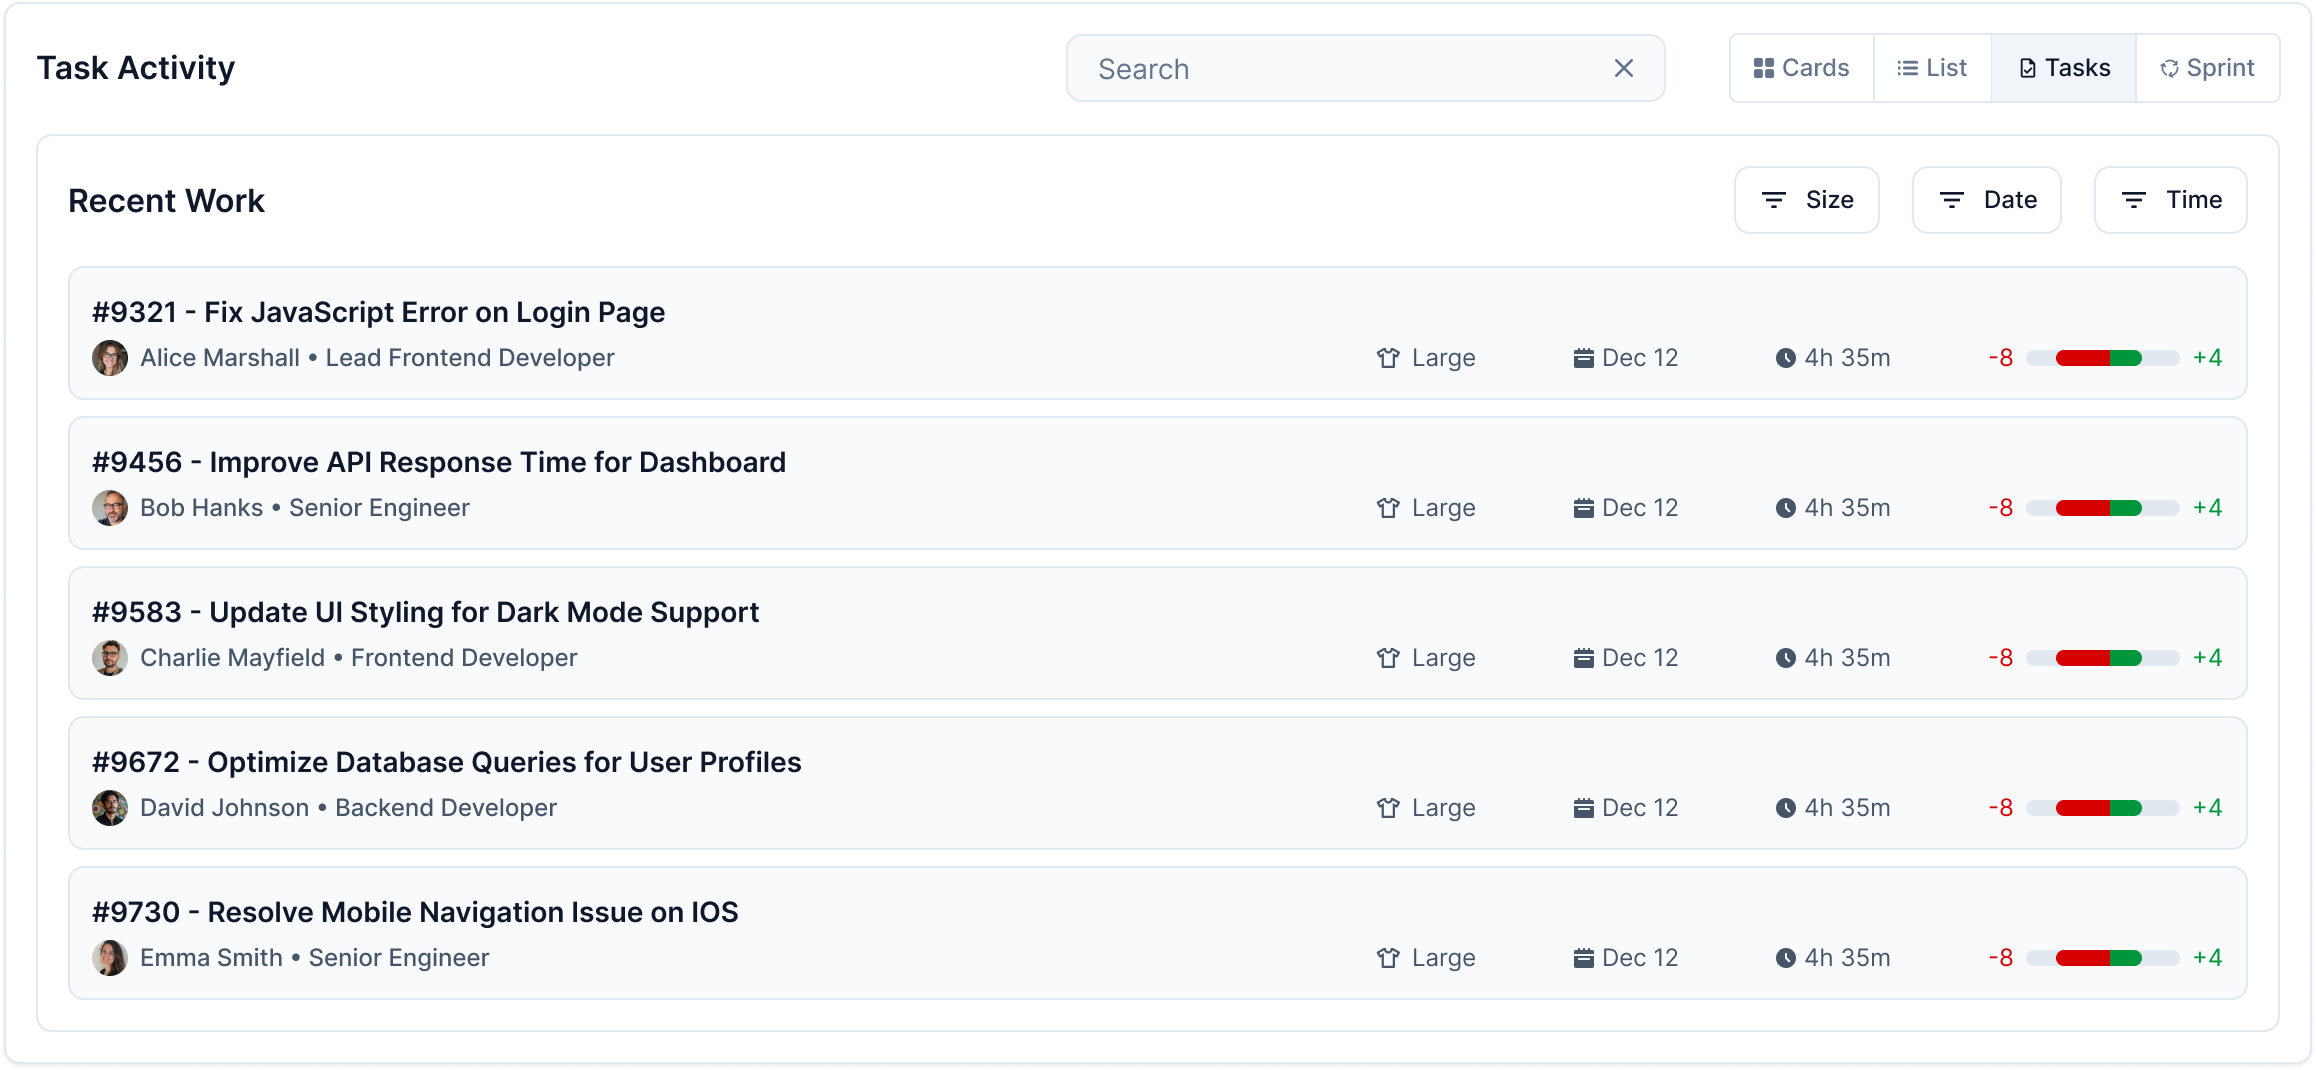
Tasks Tab (Project Pages Only)
The Tasks tab tracks individual work items, displaying time spent on tasks along with code additions and deletions. For deeper context, click a task to view the Task Work Log.
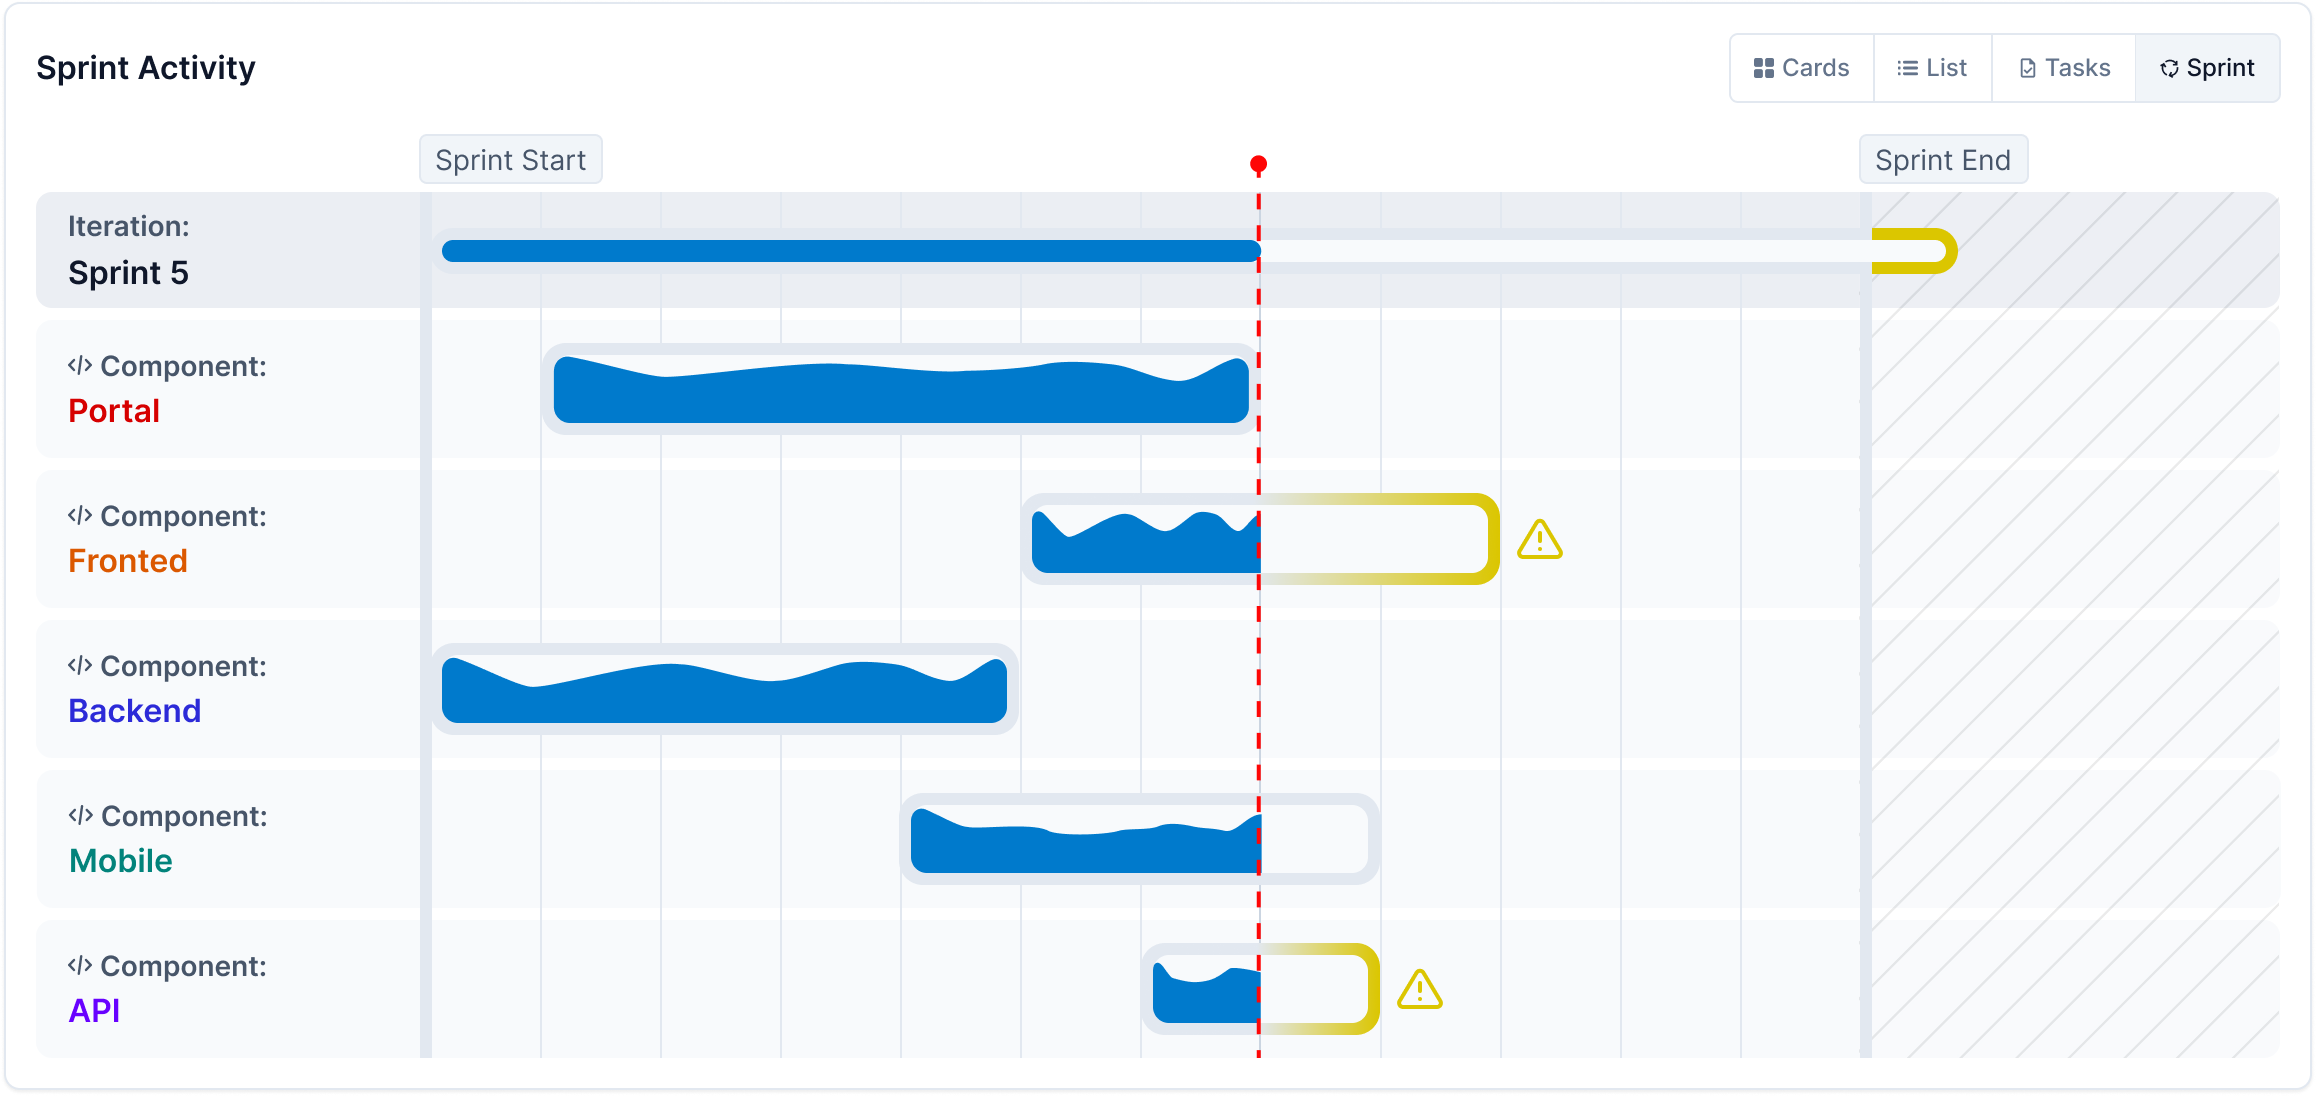
Sprint Tab (Project Pages Only)
The Sprint tab provides a timeline view of the current iteration, displaying task activity grouped by component.
Key features include:
- Uses yellow shading to flag missed targets.
- Displays warnings if a sprint is at risk of exceeding its end date, allowing for early intervention.
- Tracks activity trends within each task using a graph, highlighting dips that may need attention.
For deeper context, click a component to view the Component Work Log.