Using Work Logs
Work Logs provide a detailed breakdown of engineering activity, offering valuable insights into workflows. By analyzing these logs, teams can optimize efficiency, balance workloads, and improve project planning.
The following work logs are available:
- Developer Work Log—Tracks individual developer activities across projects.
- Task Work Log—Details progress and time spent on specific tasks.
- Component Work Log—Captures activity related to specific components.
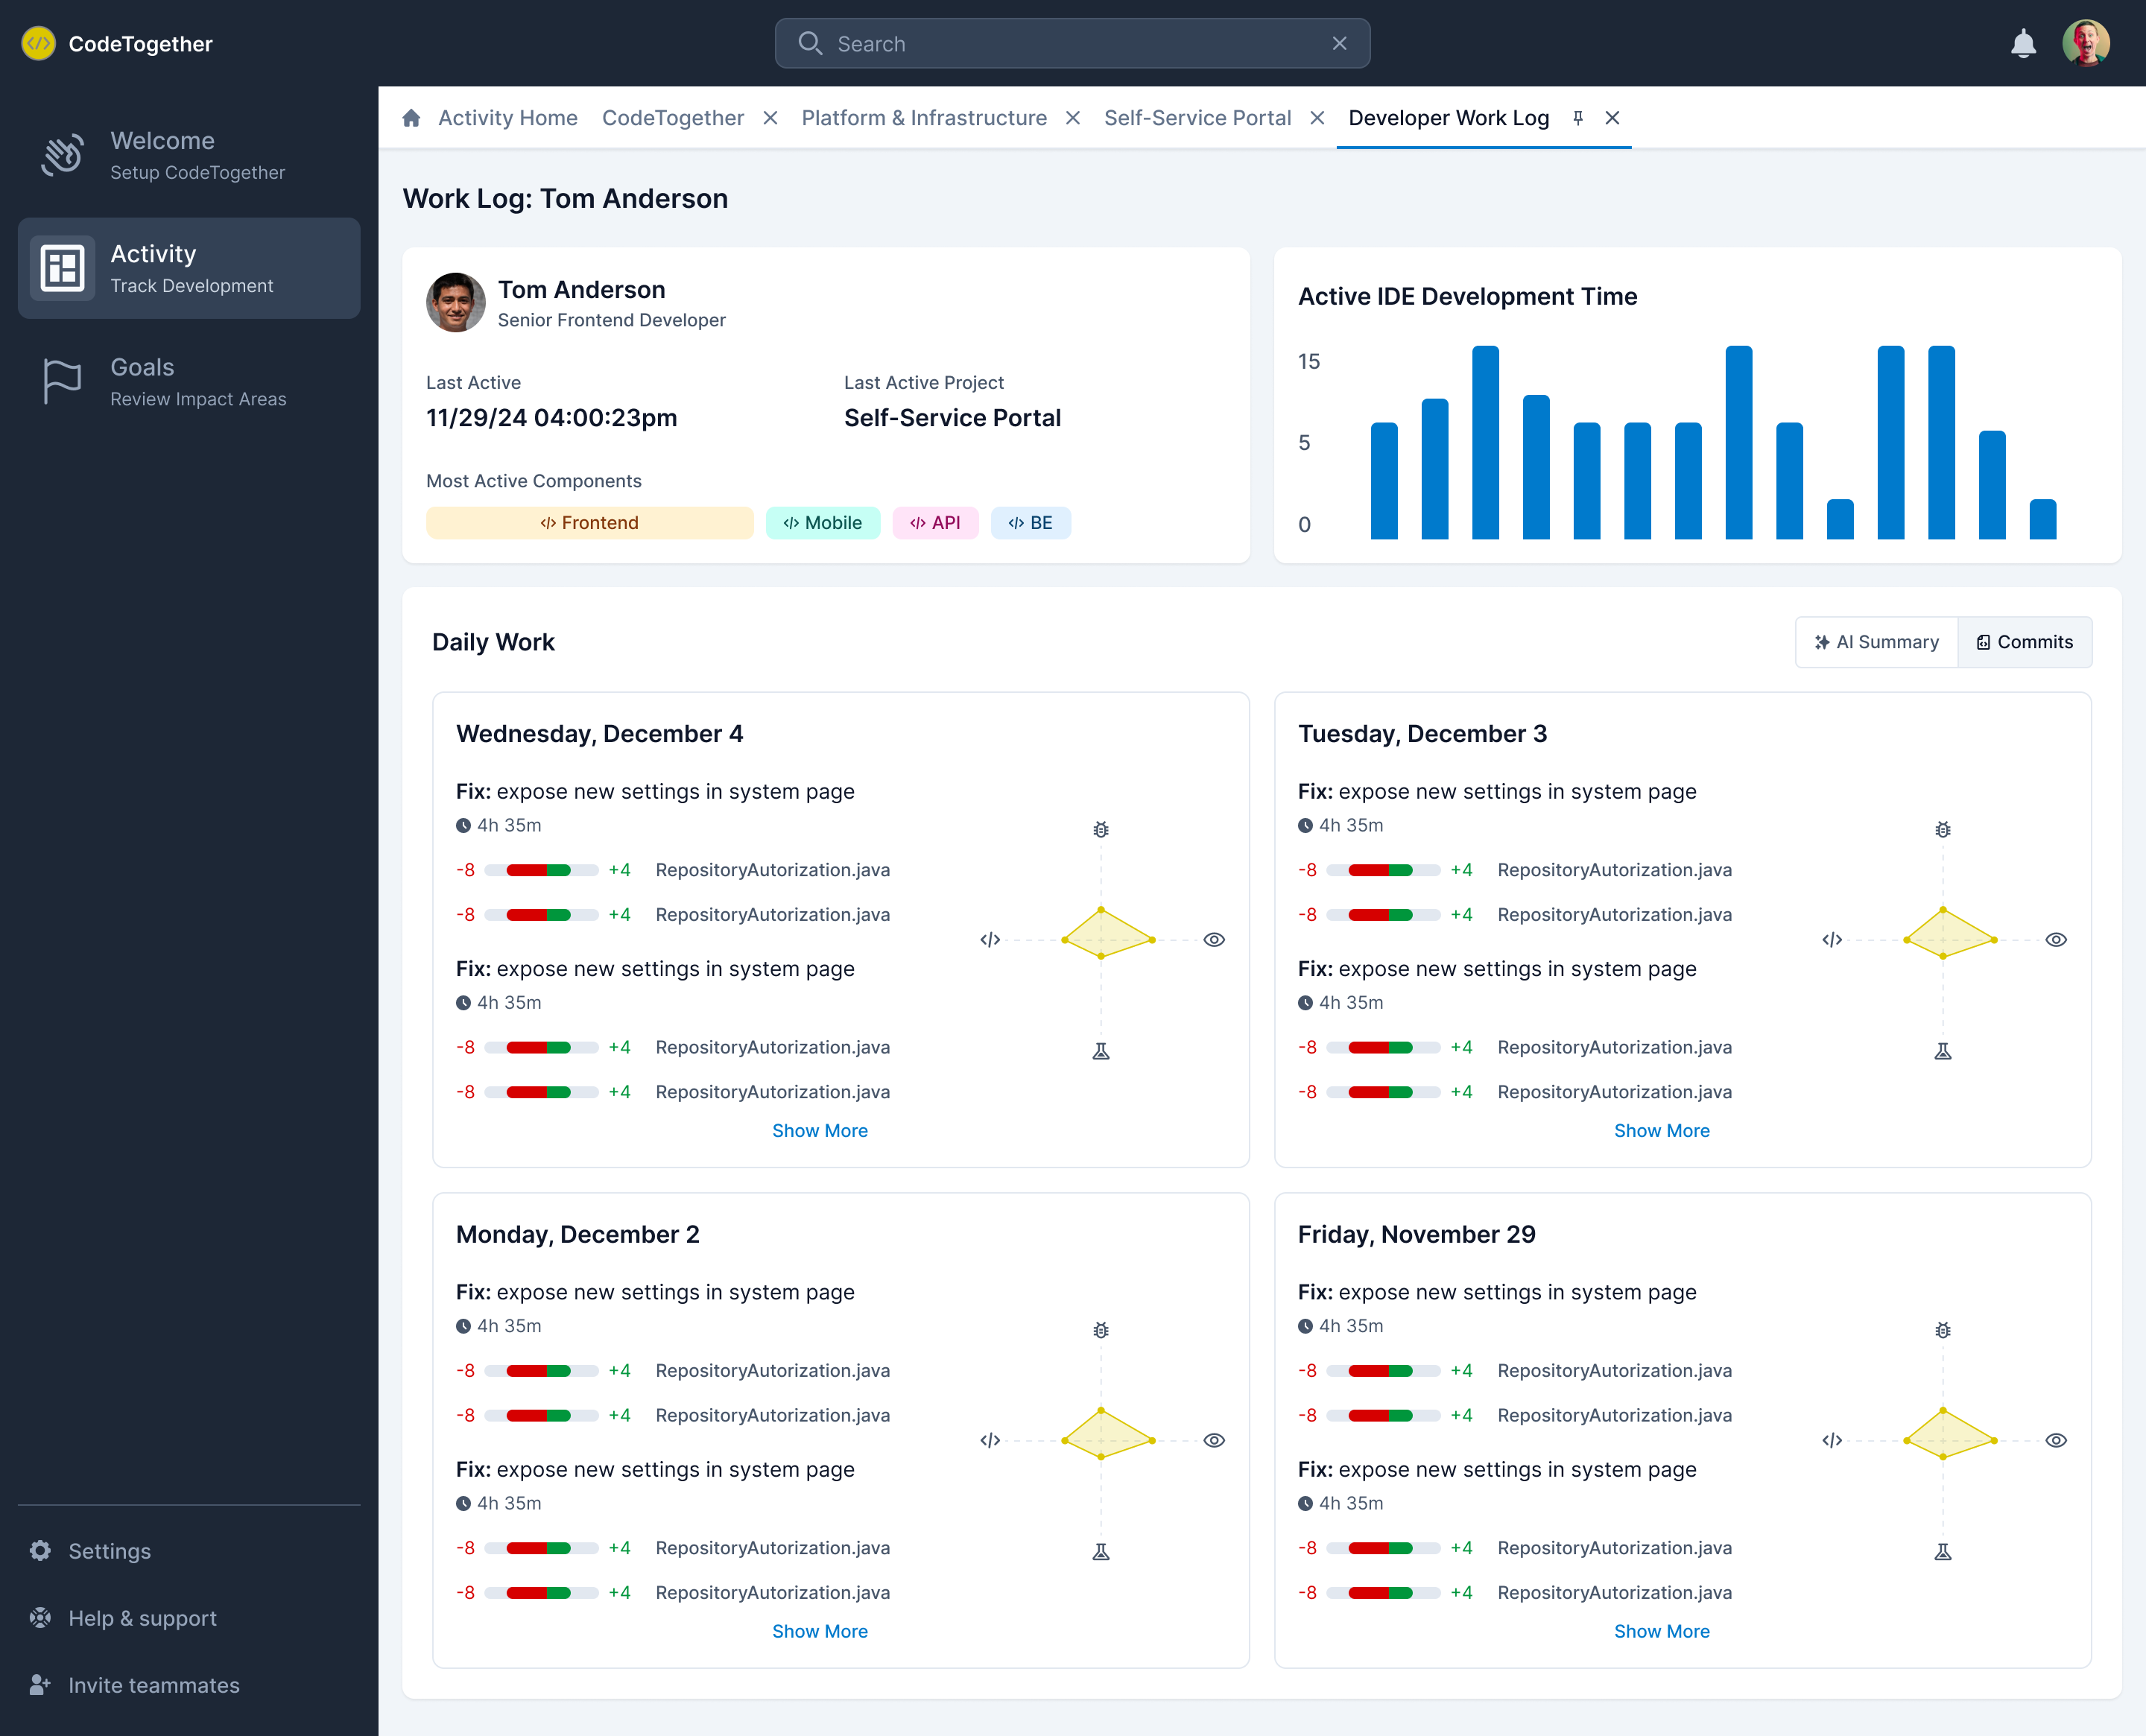
Developer Work Log
Tracks a developer’s daily activity, including IDE usage, active coding time, and contributions.
To view the Developer Work Log:
- Open a Project page in the Activity Dashboard.
- Select the Cards or List tab to view Developer Activity.
- Click a developer’s name.
- Review a summary of the developer’s activity.
- Review the AI Summary of the developer’s daily activity.
- Click the Commits tab to see a daily breakdown of the tasks the developer has worked on, including the number of lines of code added to or deleted from each file associated with the task.
- View the radar graph to analyze how the developer allocated time across debugging, exploration, testing, and coding.
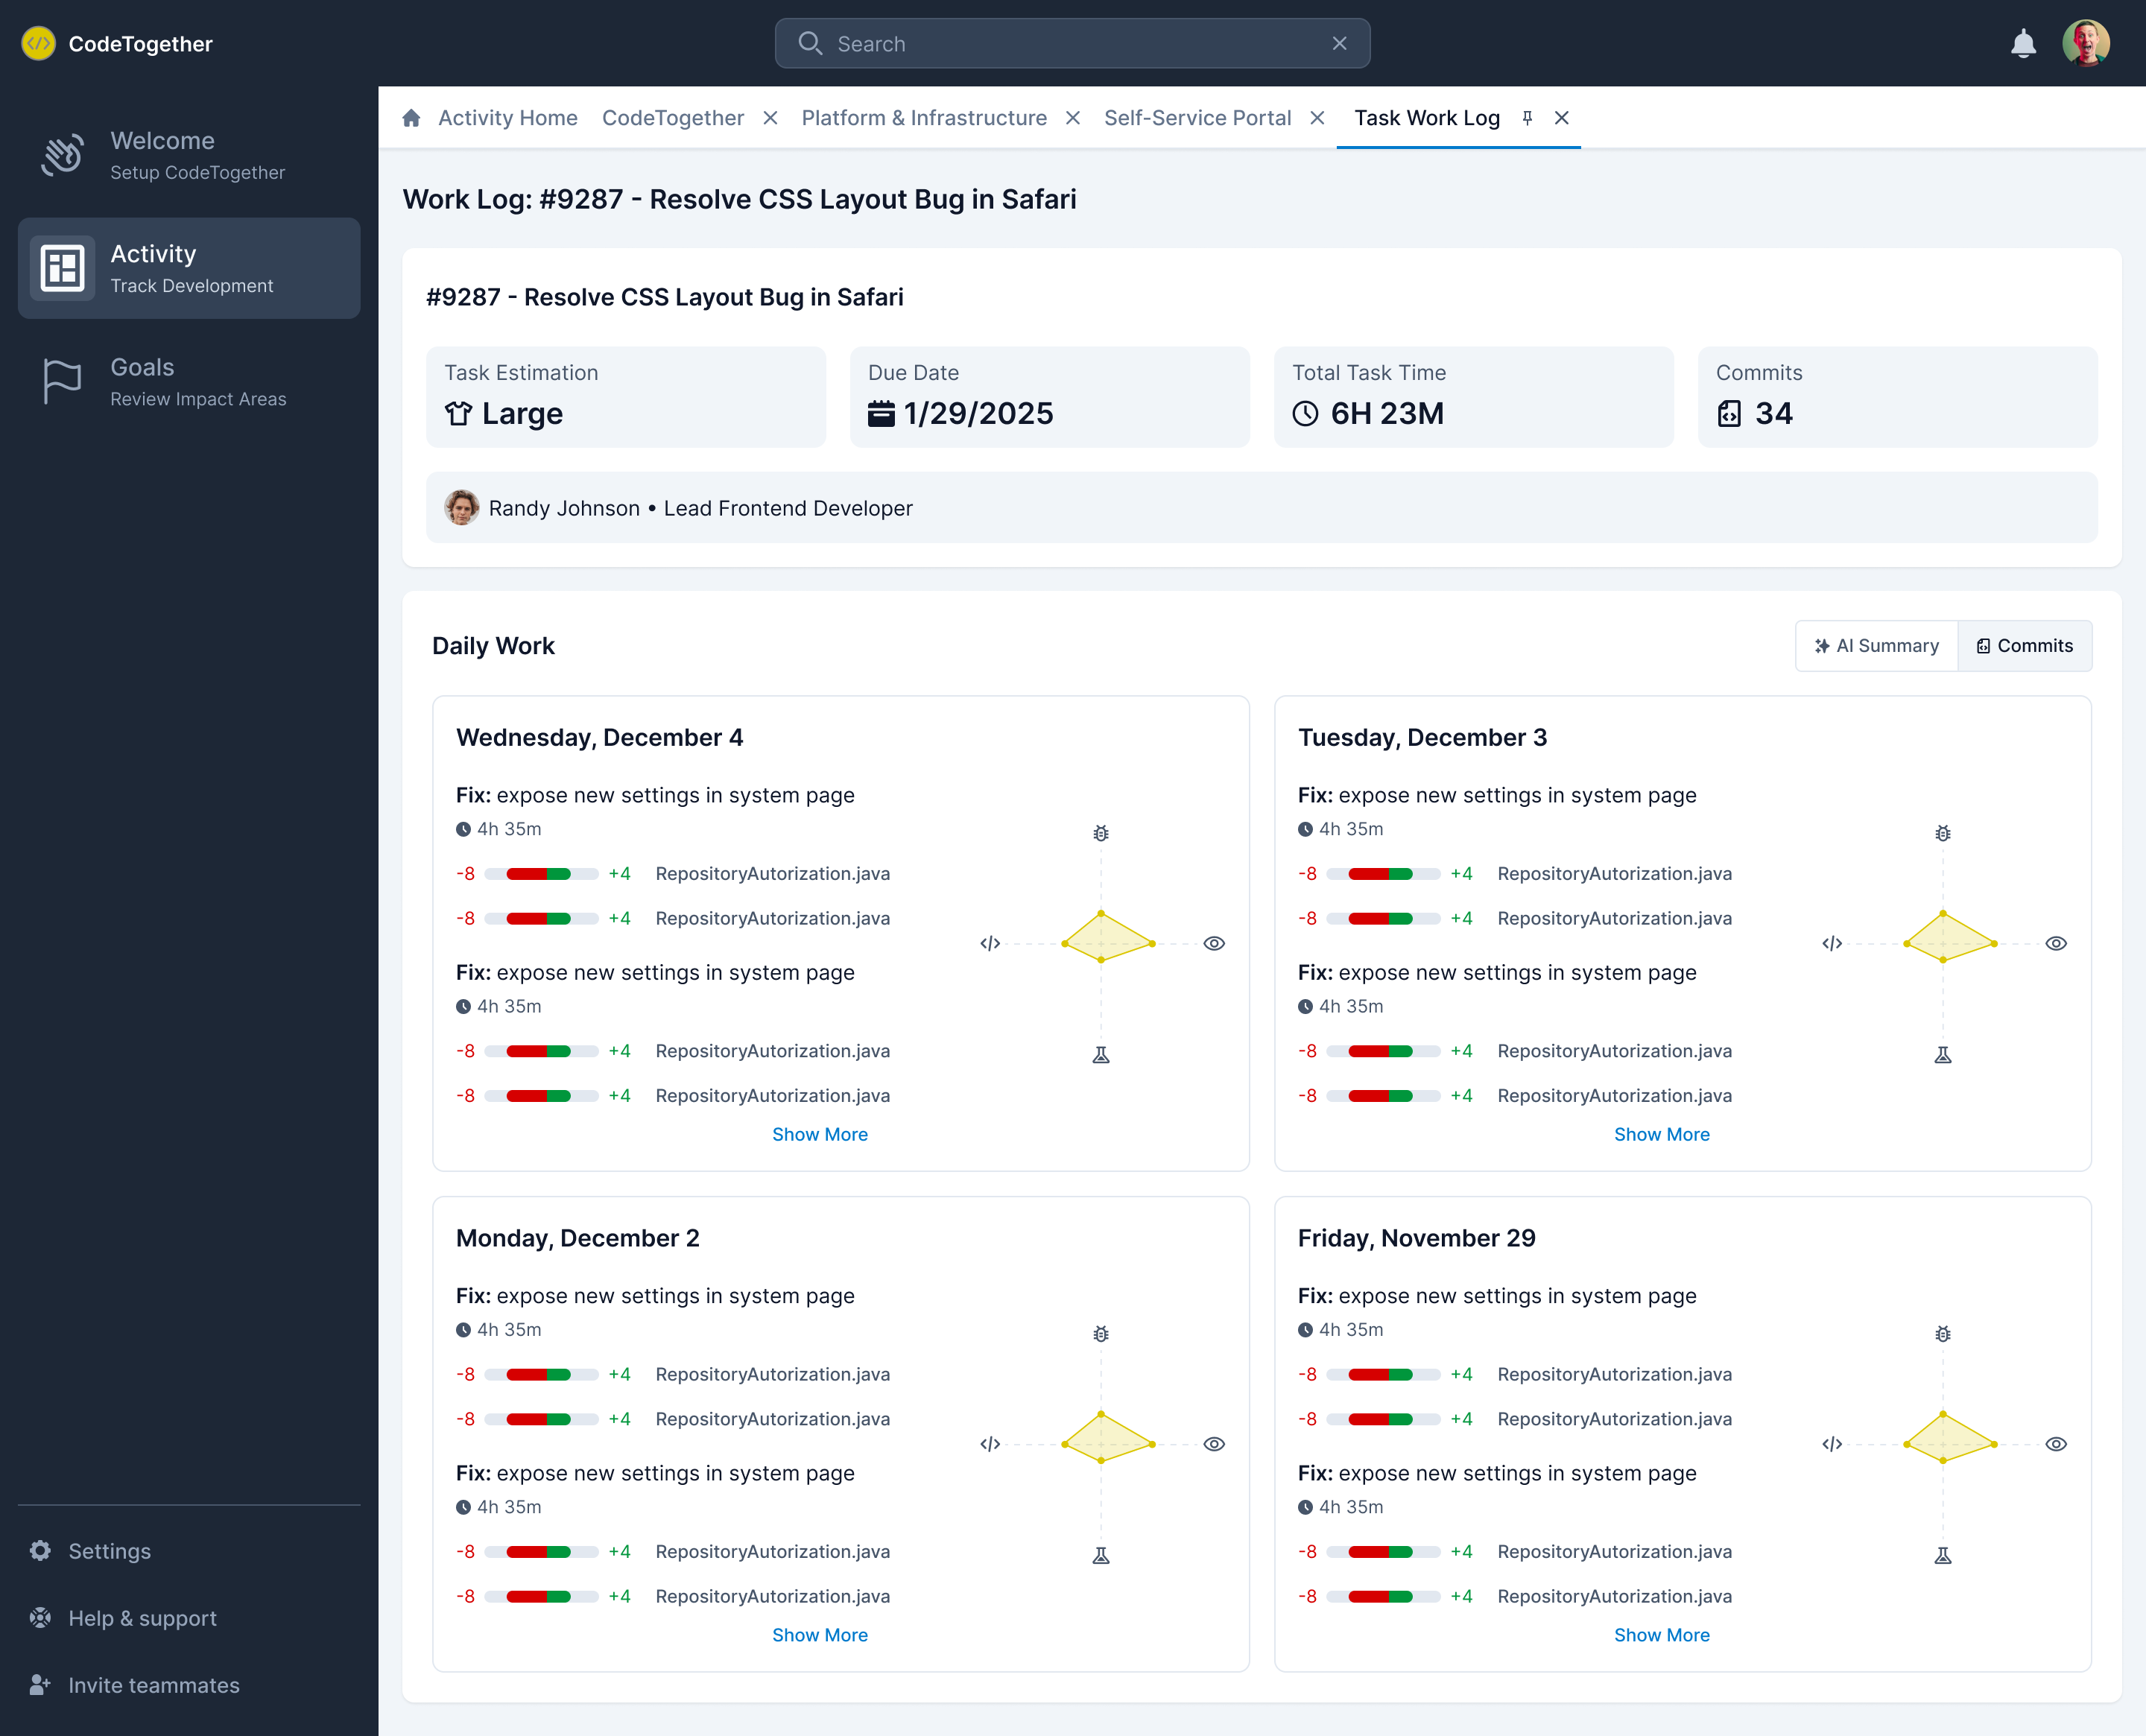
Task Work Log
Tracks task-specific activity, including progress and time spent on a given task.
To view the Task Work Log:
- Open a Project page in the Activity Dashboard.
- Select the Tasks tab to view Task Activity.
- Click a task name.
- Review a summary of the task.
- Review the AI Summary of the daily activity for the task.
- Click the Commits tab to view a daily breakdown of task activity, including lines of code added or removed from each associated file.
- Use the adar graph to analyze how time was distributed across debugging, exploration, testing, and coding.
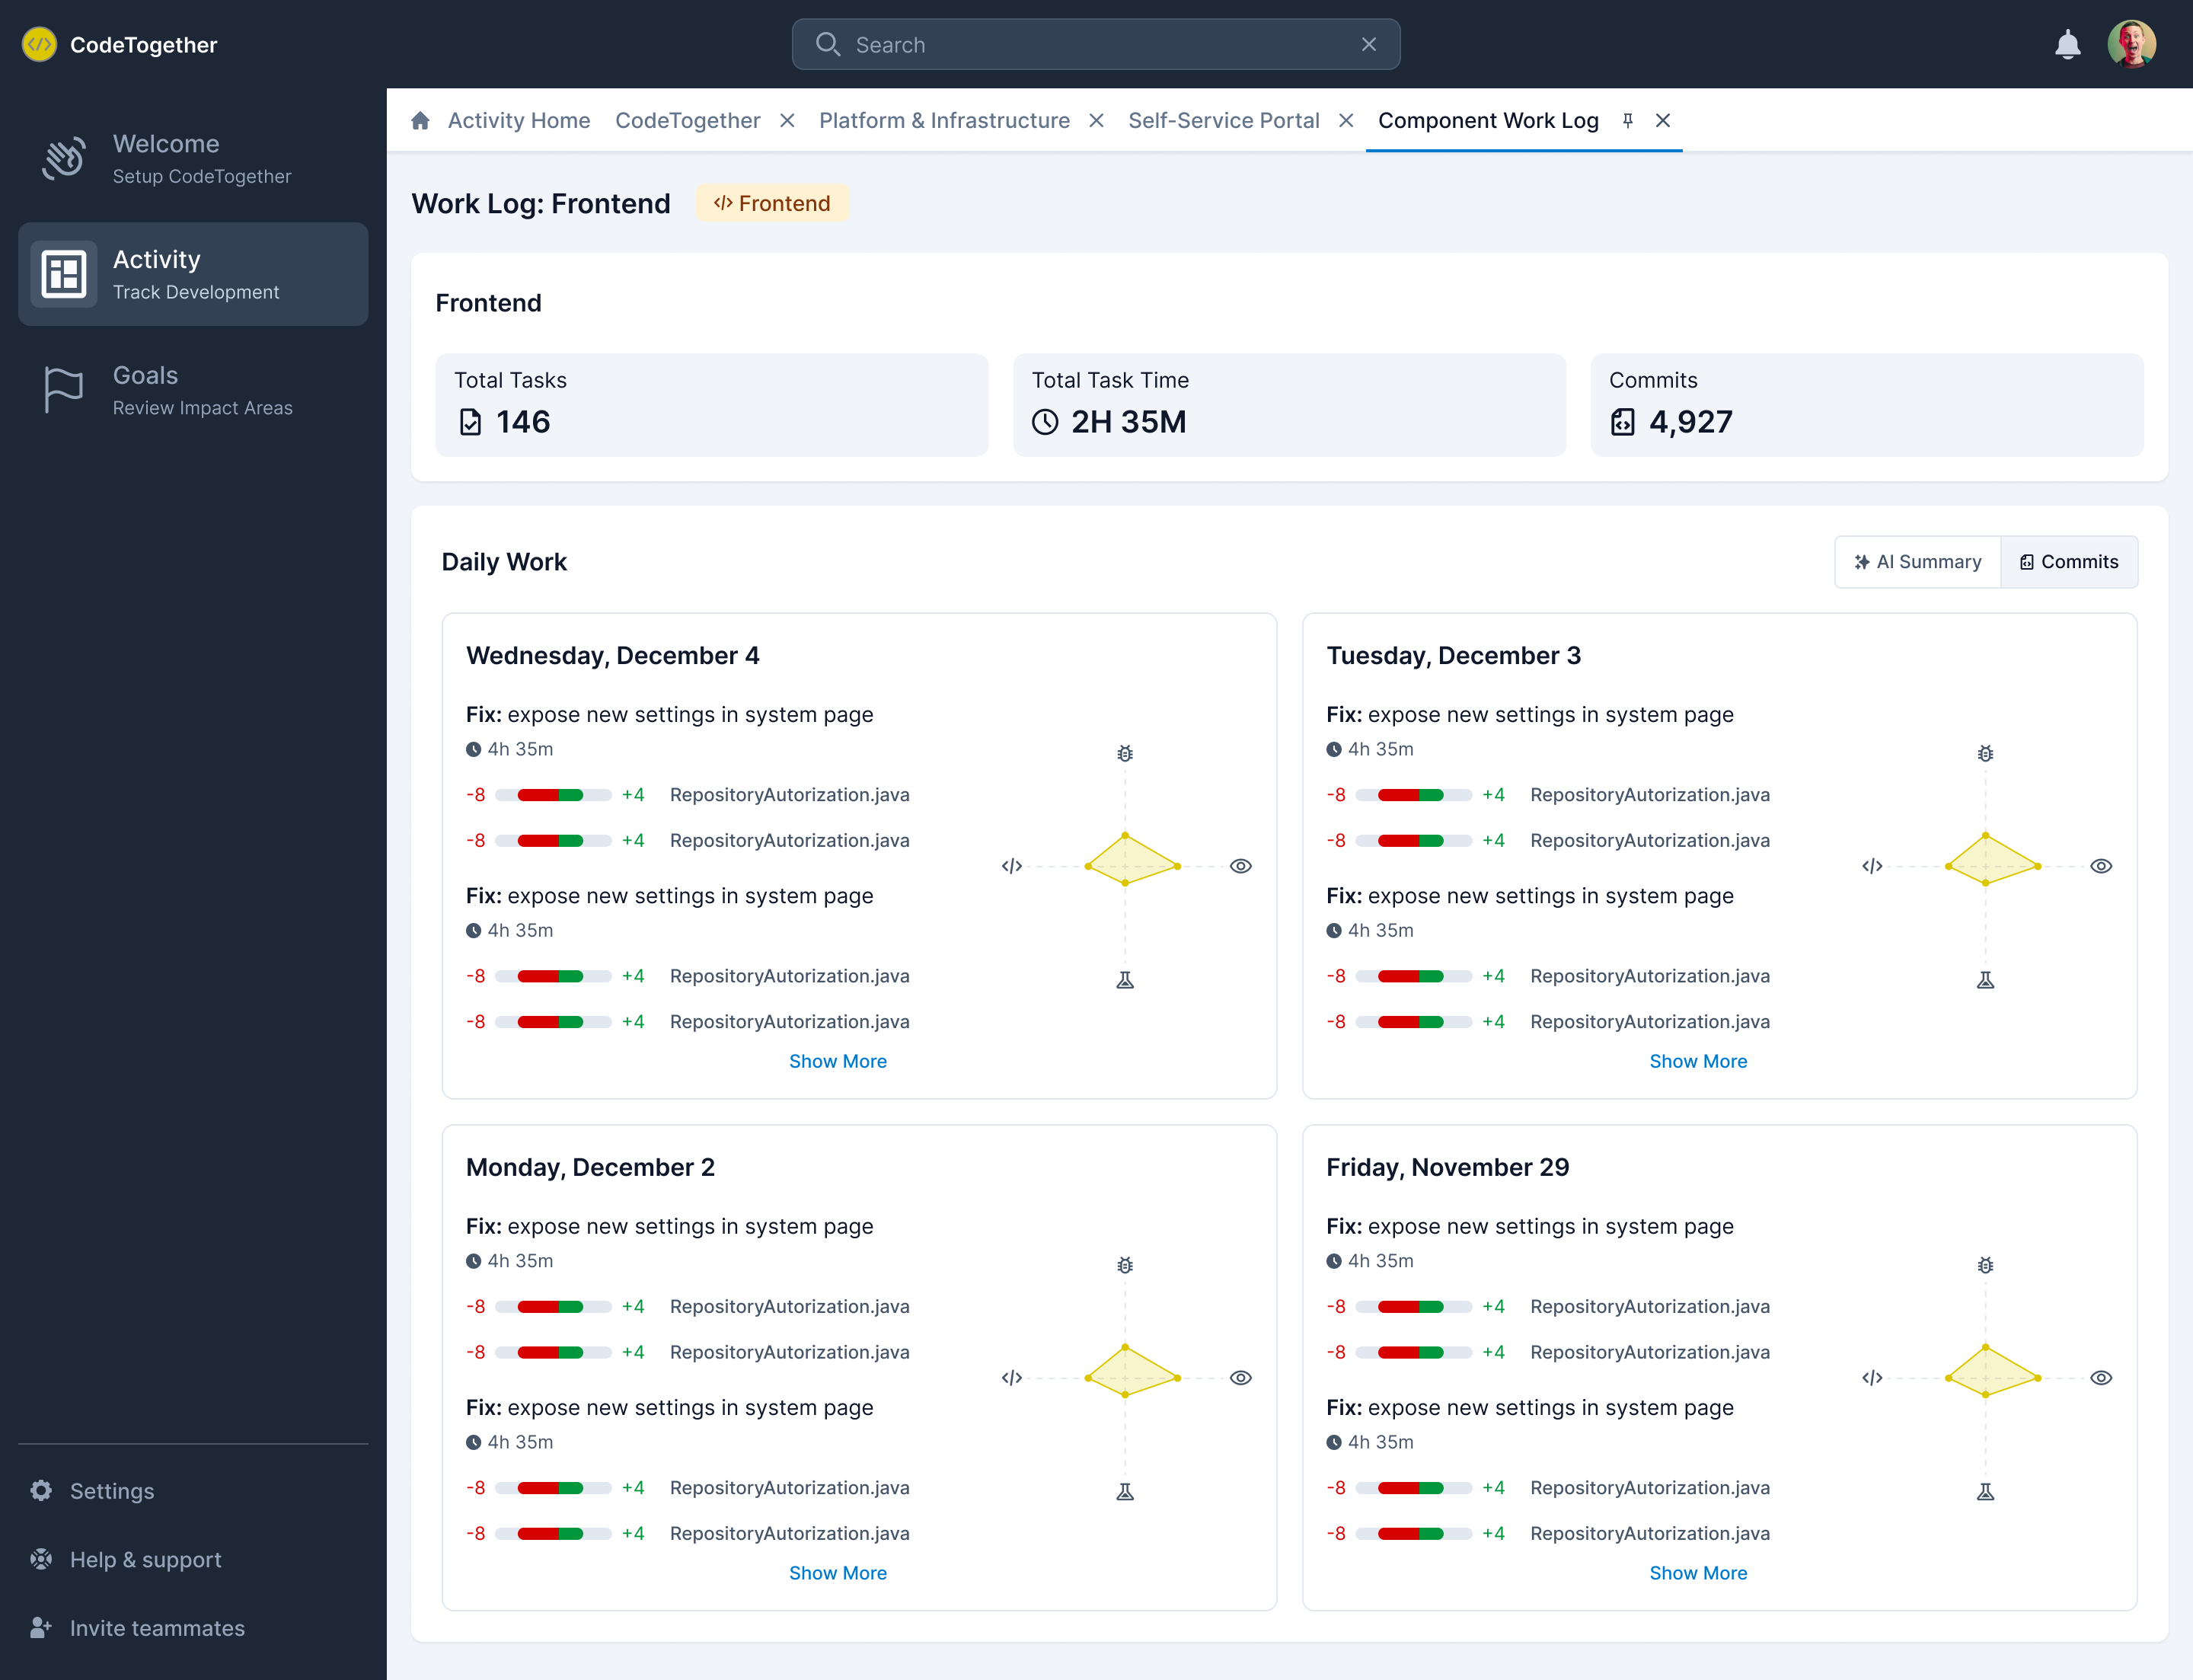
Component Work Log
Tracks activity related to specific project components.
To view the Component Work Log:
- Open a Project page in the Activity Dashboard.
- Select the Sprint tab to view Sprint Activity.
- Click a component name.
- Review a summary of the tasks associated with the component.
- Review the AI Summary of the daily activity for the task.
- Click the Commits tab to view a daily breakdown of component activity, including lines of code added or removed from each associated file.
- Use the radar graph to analyze how time was distributed across debugging, exploration, testing, and coding for tasks within the component.