Using the Activity Dashboard
The Activity Dashboard provides real-time insights into workflows, efficiency, and team engagement. It offers visibility into engineering activity across multiple levels—company, department, and project. By leveraging AI-powered insights and historical data, teams can optimize workflows, detect inefficiencies, and make informed decisions with confidence.
Key Features of the Activity Dashboard
- Track real-time workflow updates, including coding activity, task completion, and sprint progress.
- Ensure alignment between engineering efforts and company goals.
- Receive AI-powered recommendations for workflow optimization.
- Analyze team engagement, contributions, and potential bottlenecks.
- Integrate with work logs for detailed breakdowns of coding time and task progression.
Accessing the Activity Dashboard
To access the Activity Dashboard:
- Open the CodeTogether Portal.
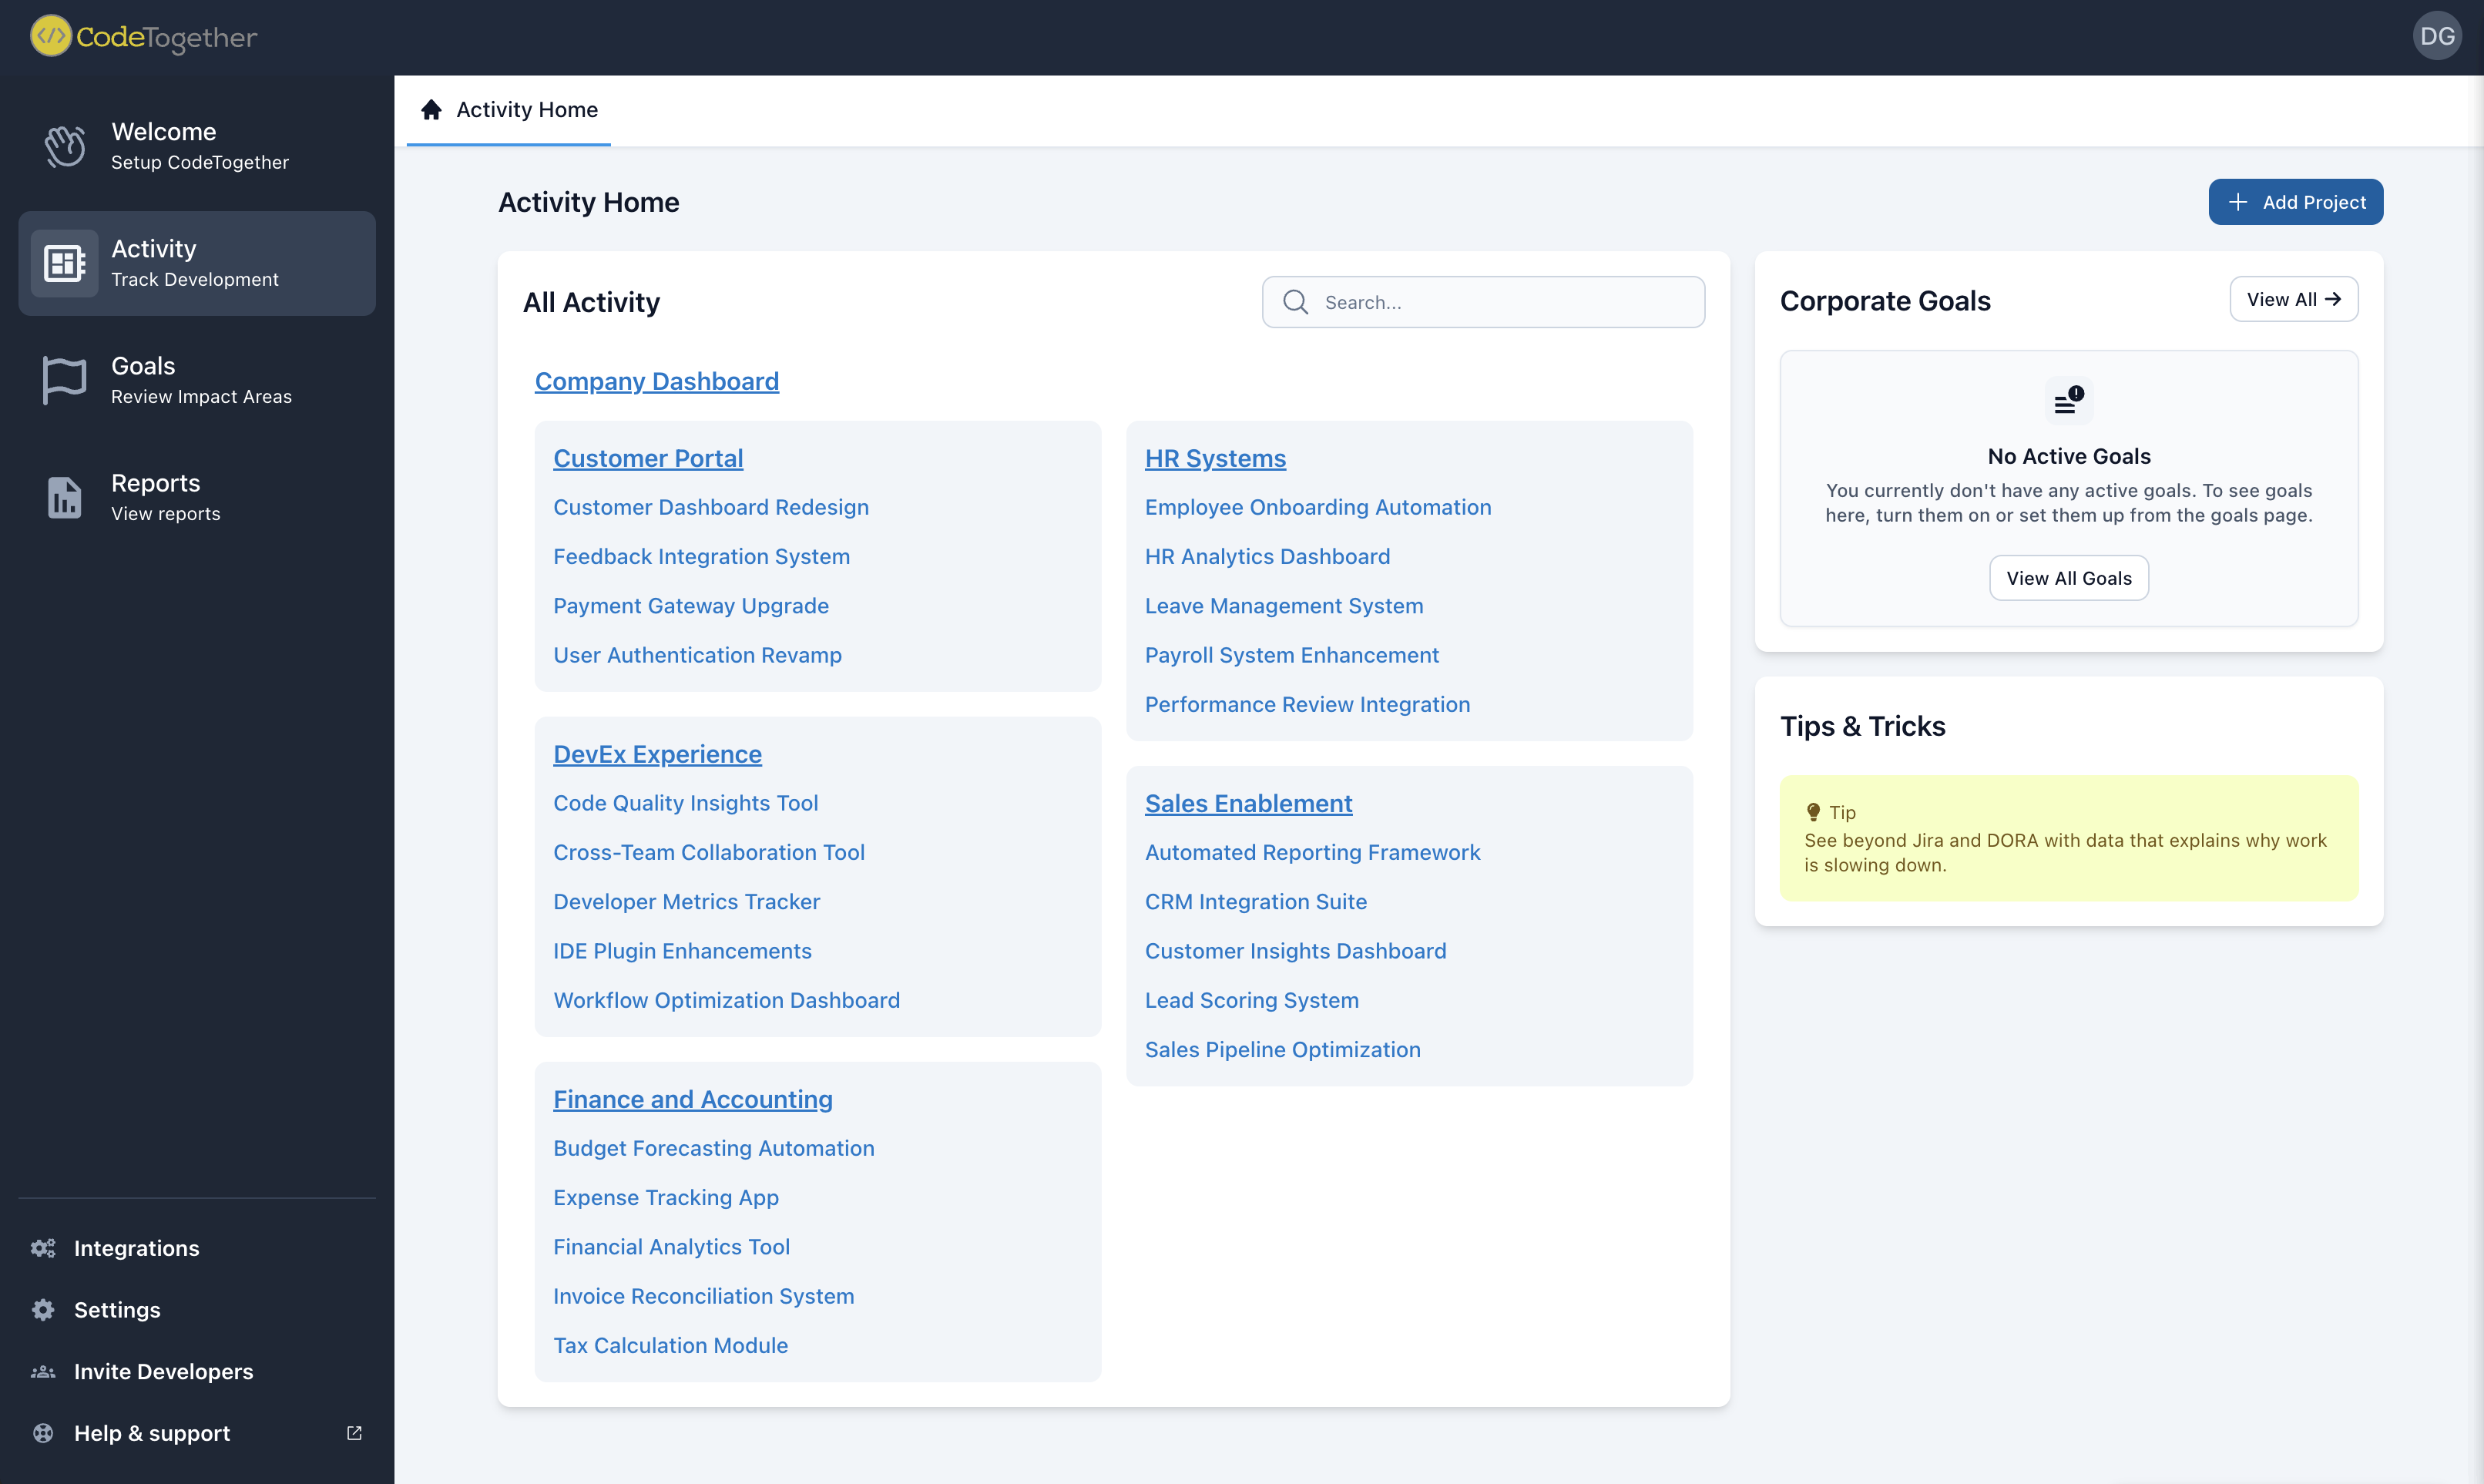
- Select Activity from the sidebar to open the Activity Home page. This page provides a navigable hierarchy of the company's departments and projects.
- Choose a page from the following levels:
- Company–For organization-wide activity and workflow trends.
- Department–For department-specific engineering activities.
- Project–For project-level insights, including:
- Developer activity
- Task progress
- Sprint status
Understanding the Activity Dashboard
Each Activity Dashboard page—Company, Department, or Project—consists of three main sections:
- Summary Section — Displays a workflow summary at both the Department and Company levels. For Projects, two additional tabs are shown: Top Sources and Project Setup.
- Insights Section — Shows Active Goals, Recommendations, and Watched Metrics.
- Activity Section — Displays relevant activity depending on the context: Company, Department, or Project.
All Metrics Section
The Overview Summary Section in the Activity Dashboard provides a comprehensive summary of engineering activity, project status and workflow efficiency depending on the selected type of page (Company, Department, or Project).
Summary Tab
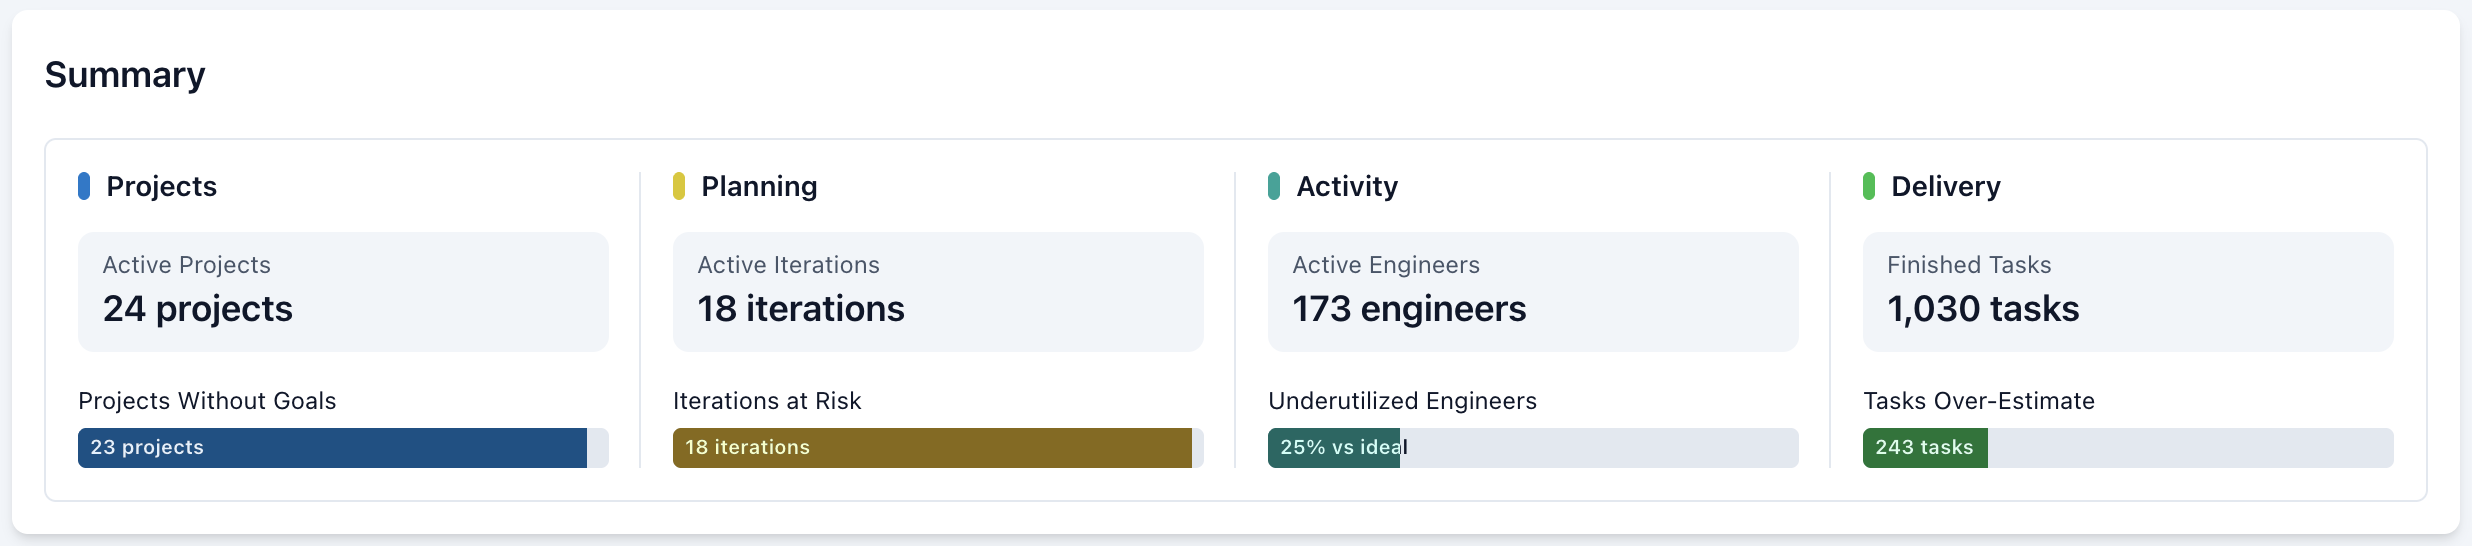
Provides a high-level view of engineering progress and key performance indicators. The first section in this tab is an overview of key metrics. The information shown depends on the selected page type:
Company & Department Summary
- Projects—The number of projects that have been active in the last four weeks and the number of projects without goals.
- Planning—The number of active iterations and the number at risk of delay.
- Activity—The number of active engineers in the last four weeks and underutilized engineers.
- Delivery—The number of tasks completed in the last four weeks, along with tasks that exceeded their estimated completion time.
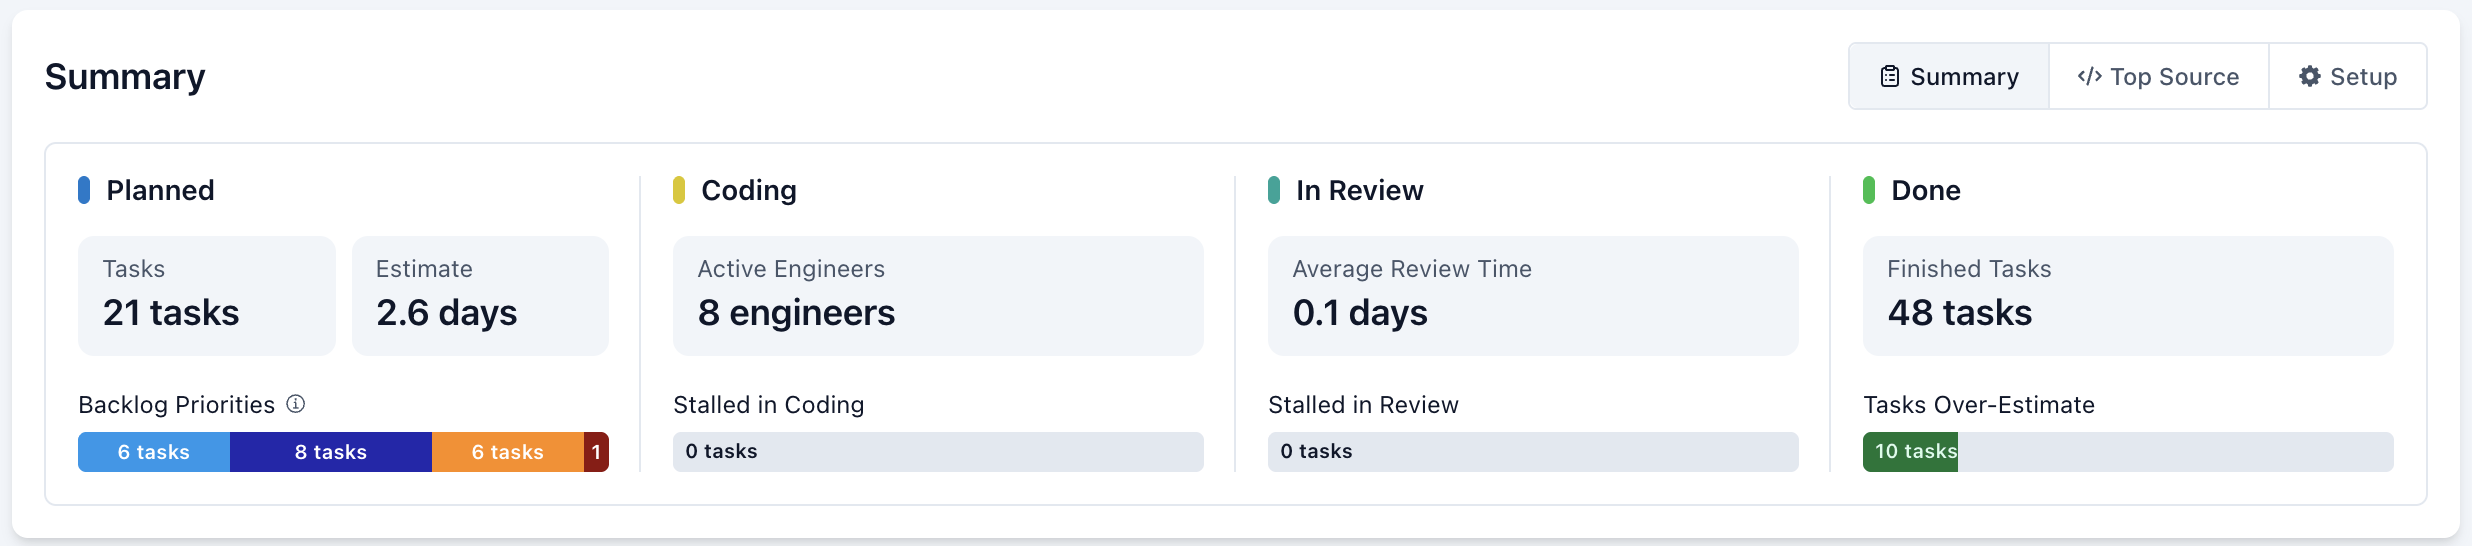
Project Summary
- Planned—Scheduled tasks and initiatives that are not yet in development.
- Coding—Active development work, including commits, branch activity, and pull requests.
- In Review—Code undergoing peer review or QA testing before merging.
- Done—Completed tasks, including merged code and finalized project deliverables.
- Project Top Source The Top Source Tab provides insights into the most active folders, repositories, and components within a selected project. It helps teams quickly identify high-impact areas of development, track engineering effort distribution, and optimize workflows. You can view source activity for a deeper analysis.
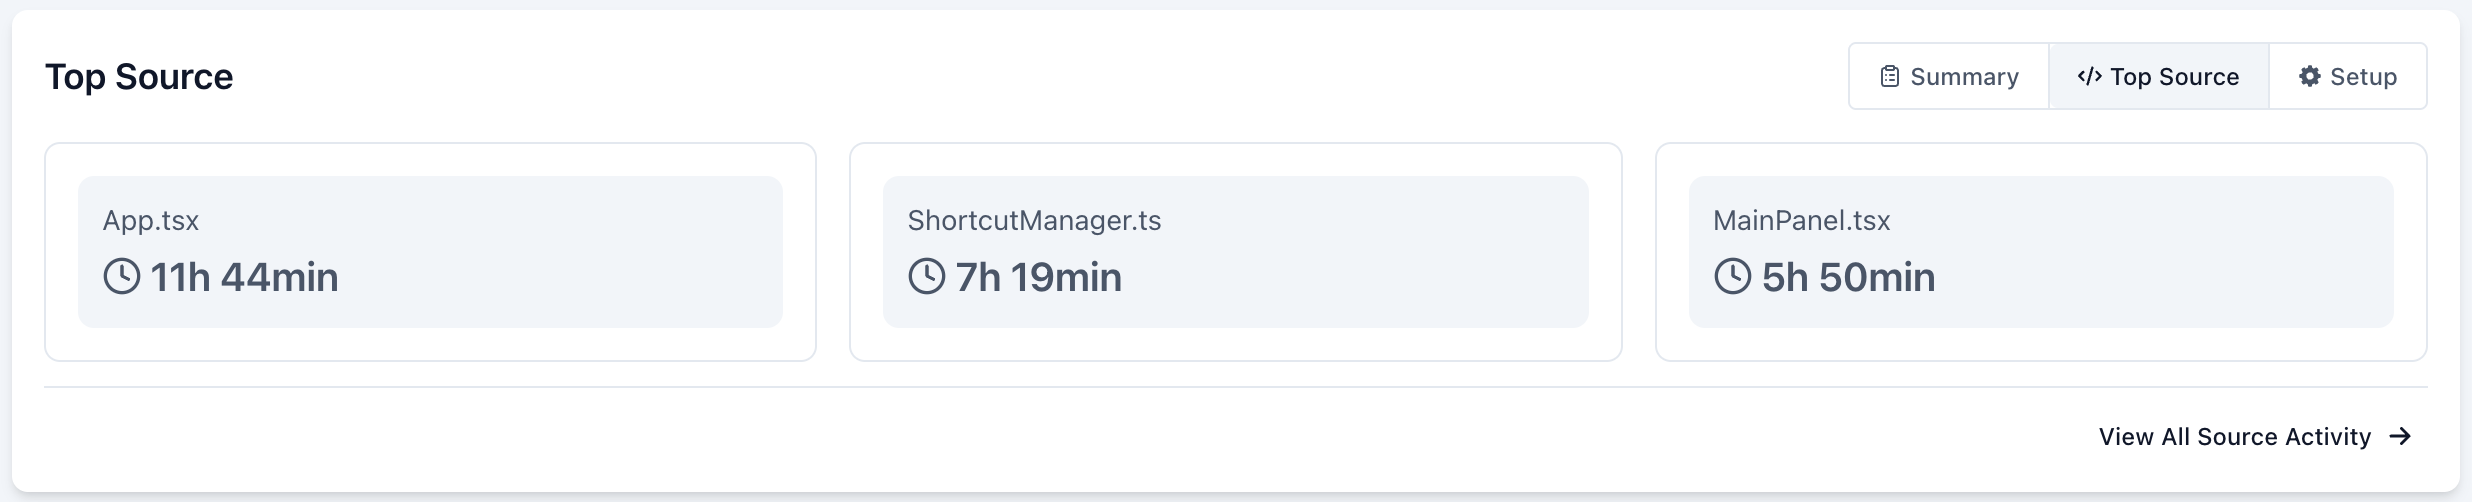
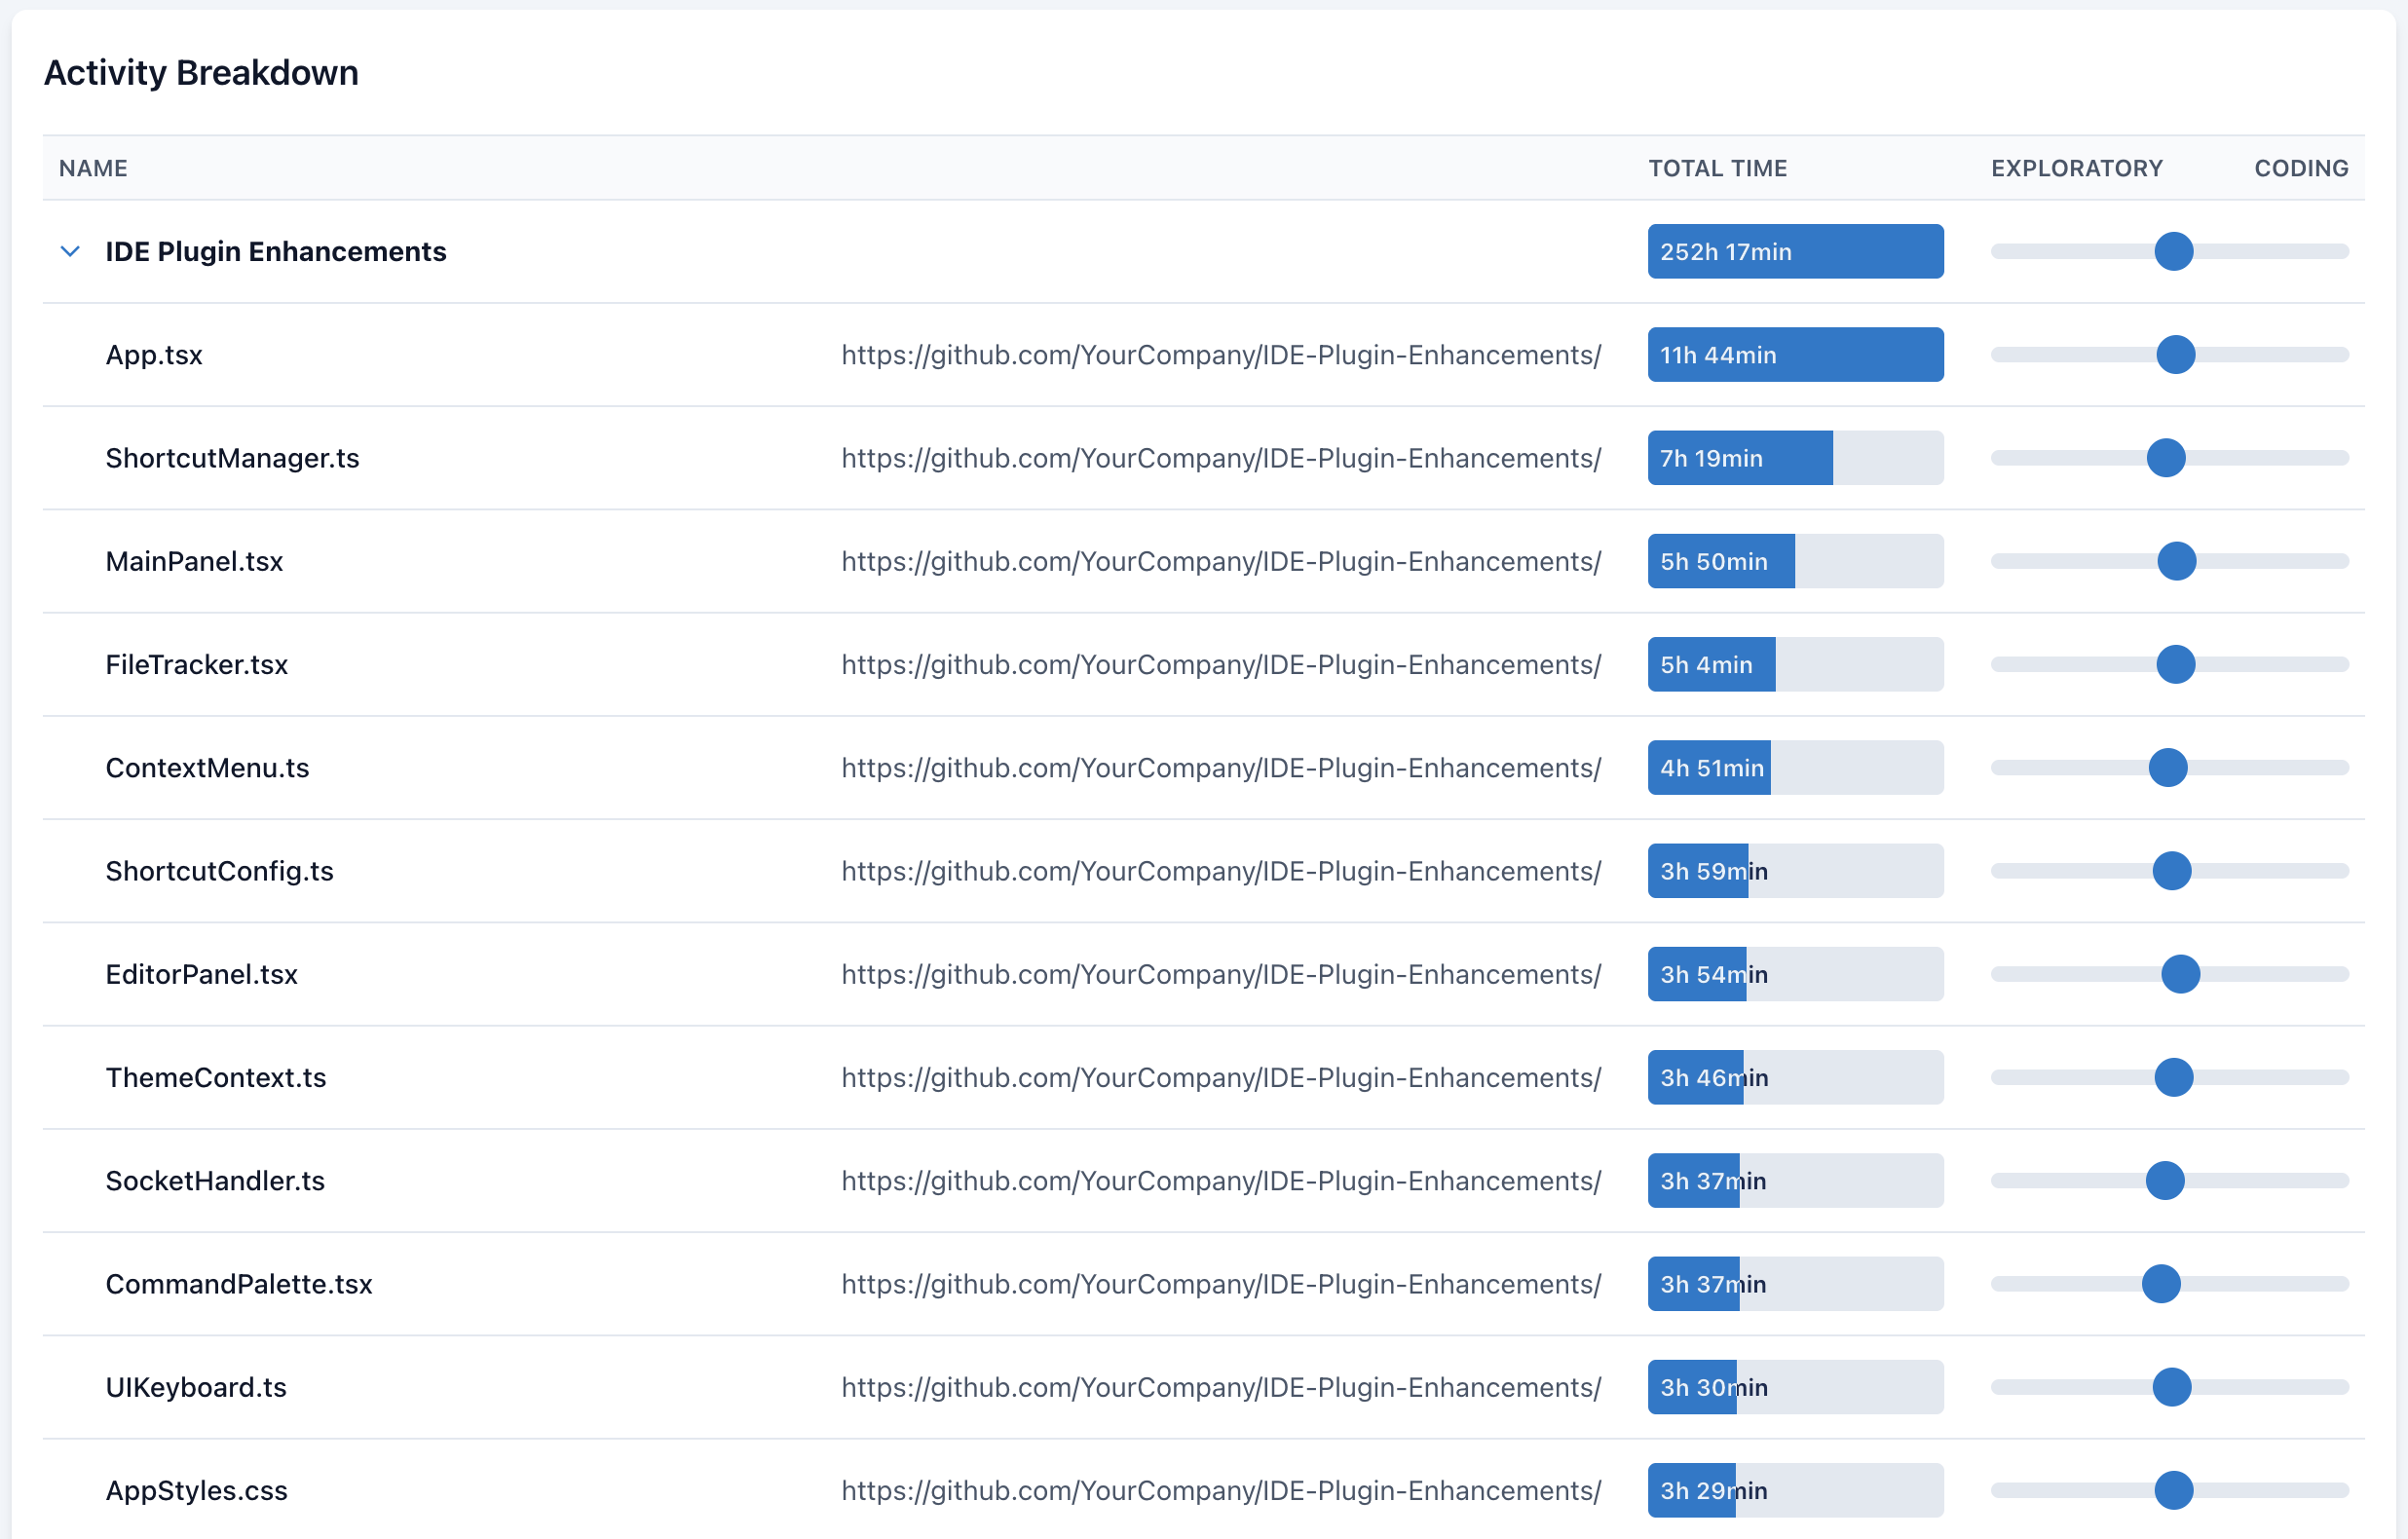
To view Source Activity, click View All Source Activity in the Top Source section. You’ll see a bar chart that highlights the most active components in the project, helping you quickly identify where the most activity is happening.
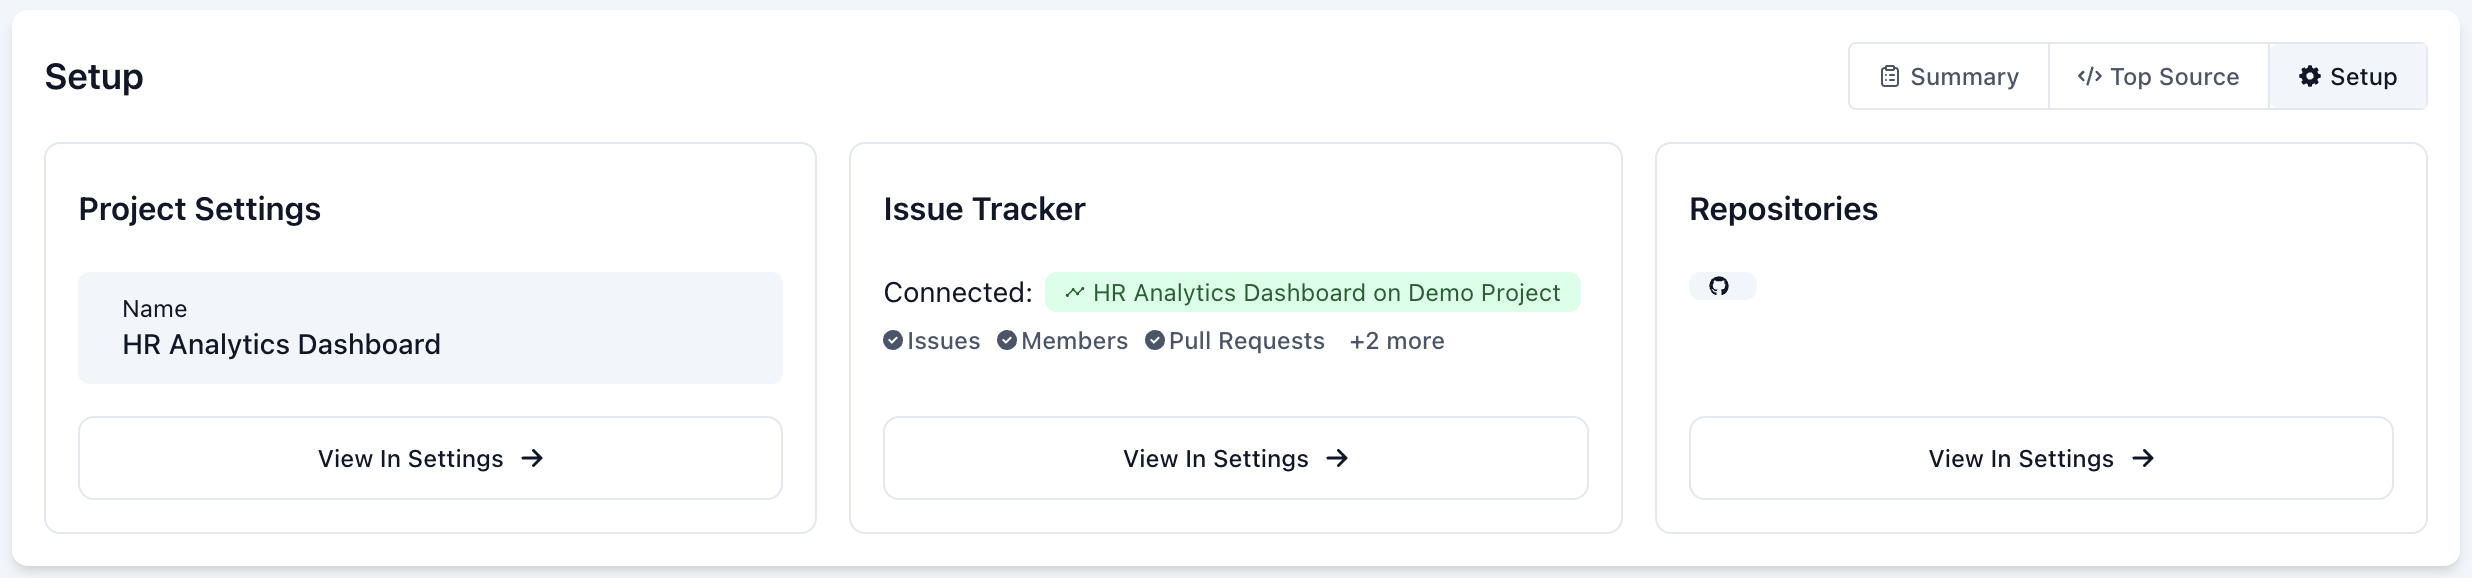
Project Setup provides a quick overview of your project's key configuration elements:
- Project Settings-Displays the project name and short name. Click View in Settings to update these values.
- Issue Tracker-Shows the connected issue tracker (e.g. GitHub) and the entities being tracked, such as Issues, Members, and Pull Requests.
- Repositories-Lists the repositories linked to your project, giving you visibility into all connected codebases. Click View in Settings to manage them.
Use this section to ensure your project is properly connected and configured before diving into activity tracking and metrics.
Insights Tab
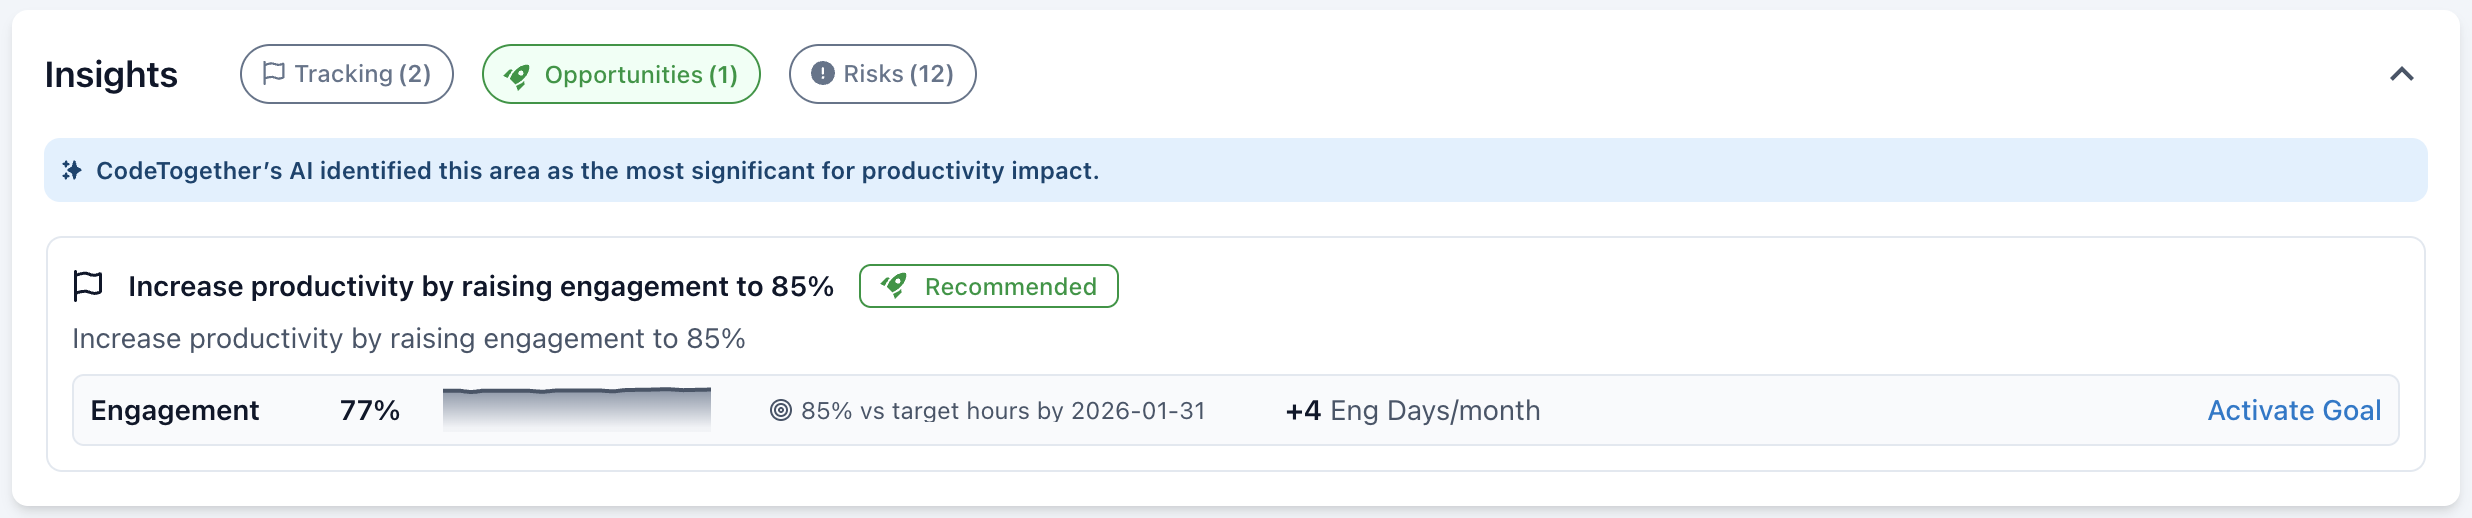
The Insights tab displays ongoing engineering goals, tracking progress against company-wide, department-specific, and project-level objectives.
![]()
On-Track Goals Track progress across company-wide, departmental, or project-specific goals. Each insight includes:
- Ongoing Goals: Monitor current objectives and their status in real time.
- AI-Powered Insights: Understand what’s driving or blocking progress with intelligent suggestions.
- Interactive Goals: Click a goal to see detailed progress, related metrics, and influencing tasks.
- Goal Management: Adjust or dismiss goals as performance trends evolve.
Watched Metrics Keep a pulse on your team’s most important metrics:
- Custom Monitoring: Select KPIs to track at a glance.
- Real-Time & Historical Trends: Spot changes early and respond faster.
- Workflow Efficiency: Detect and address inefficiencies proactively.
Opportunities Tab Boost team performance with AI-recommended goals based on historical data and activity patterns:
- Top Recommendations: Discover goals that can drive the most productivity impact.
- Impact Forecast: Each opportunity includes an estimated value (e.g. +21 Eng Days/month).
- One-Click Activation: Quickly enable goals that align with your objectives.
Example: Raise engagement from 40% to 55% to unlock +21 Engineering Days/month—recommended based on your team’s current data.
Activity Section
The Activity Section provides real-time tracking of engineering work, allowing teams to view ongoing progress through different visualization formats.
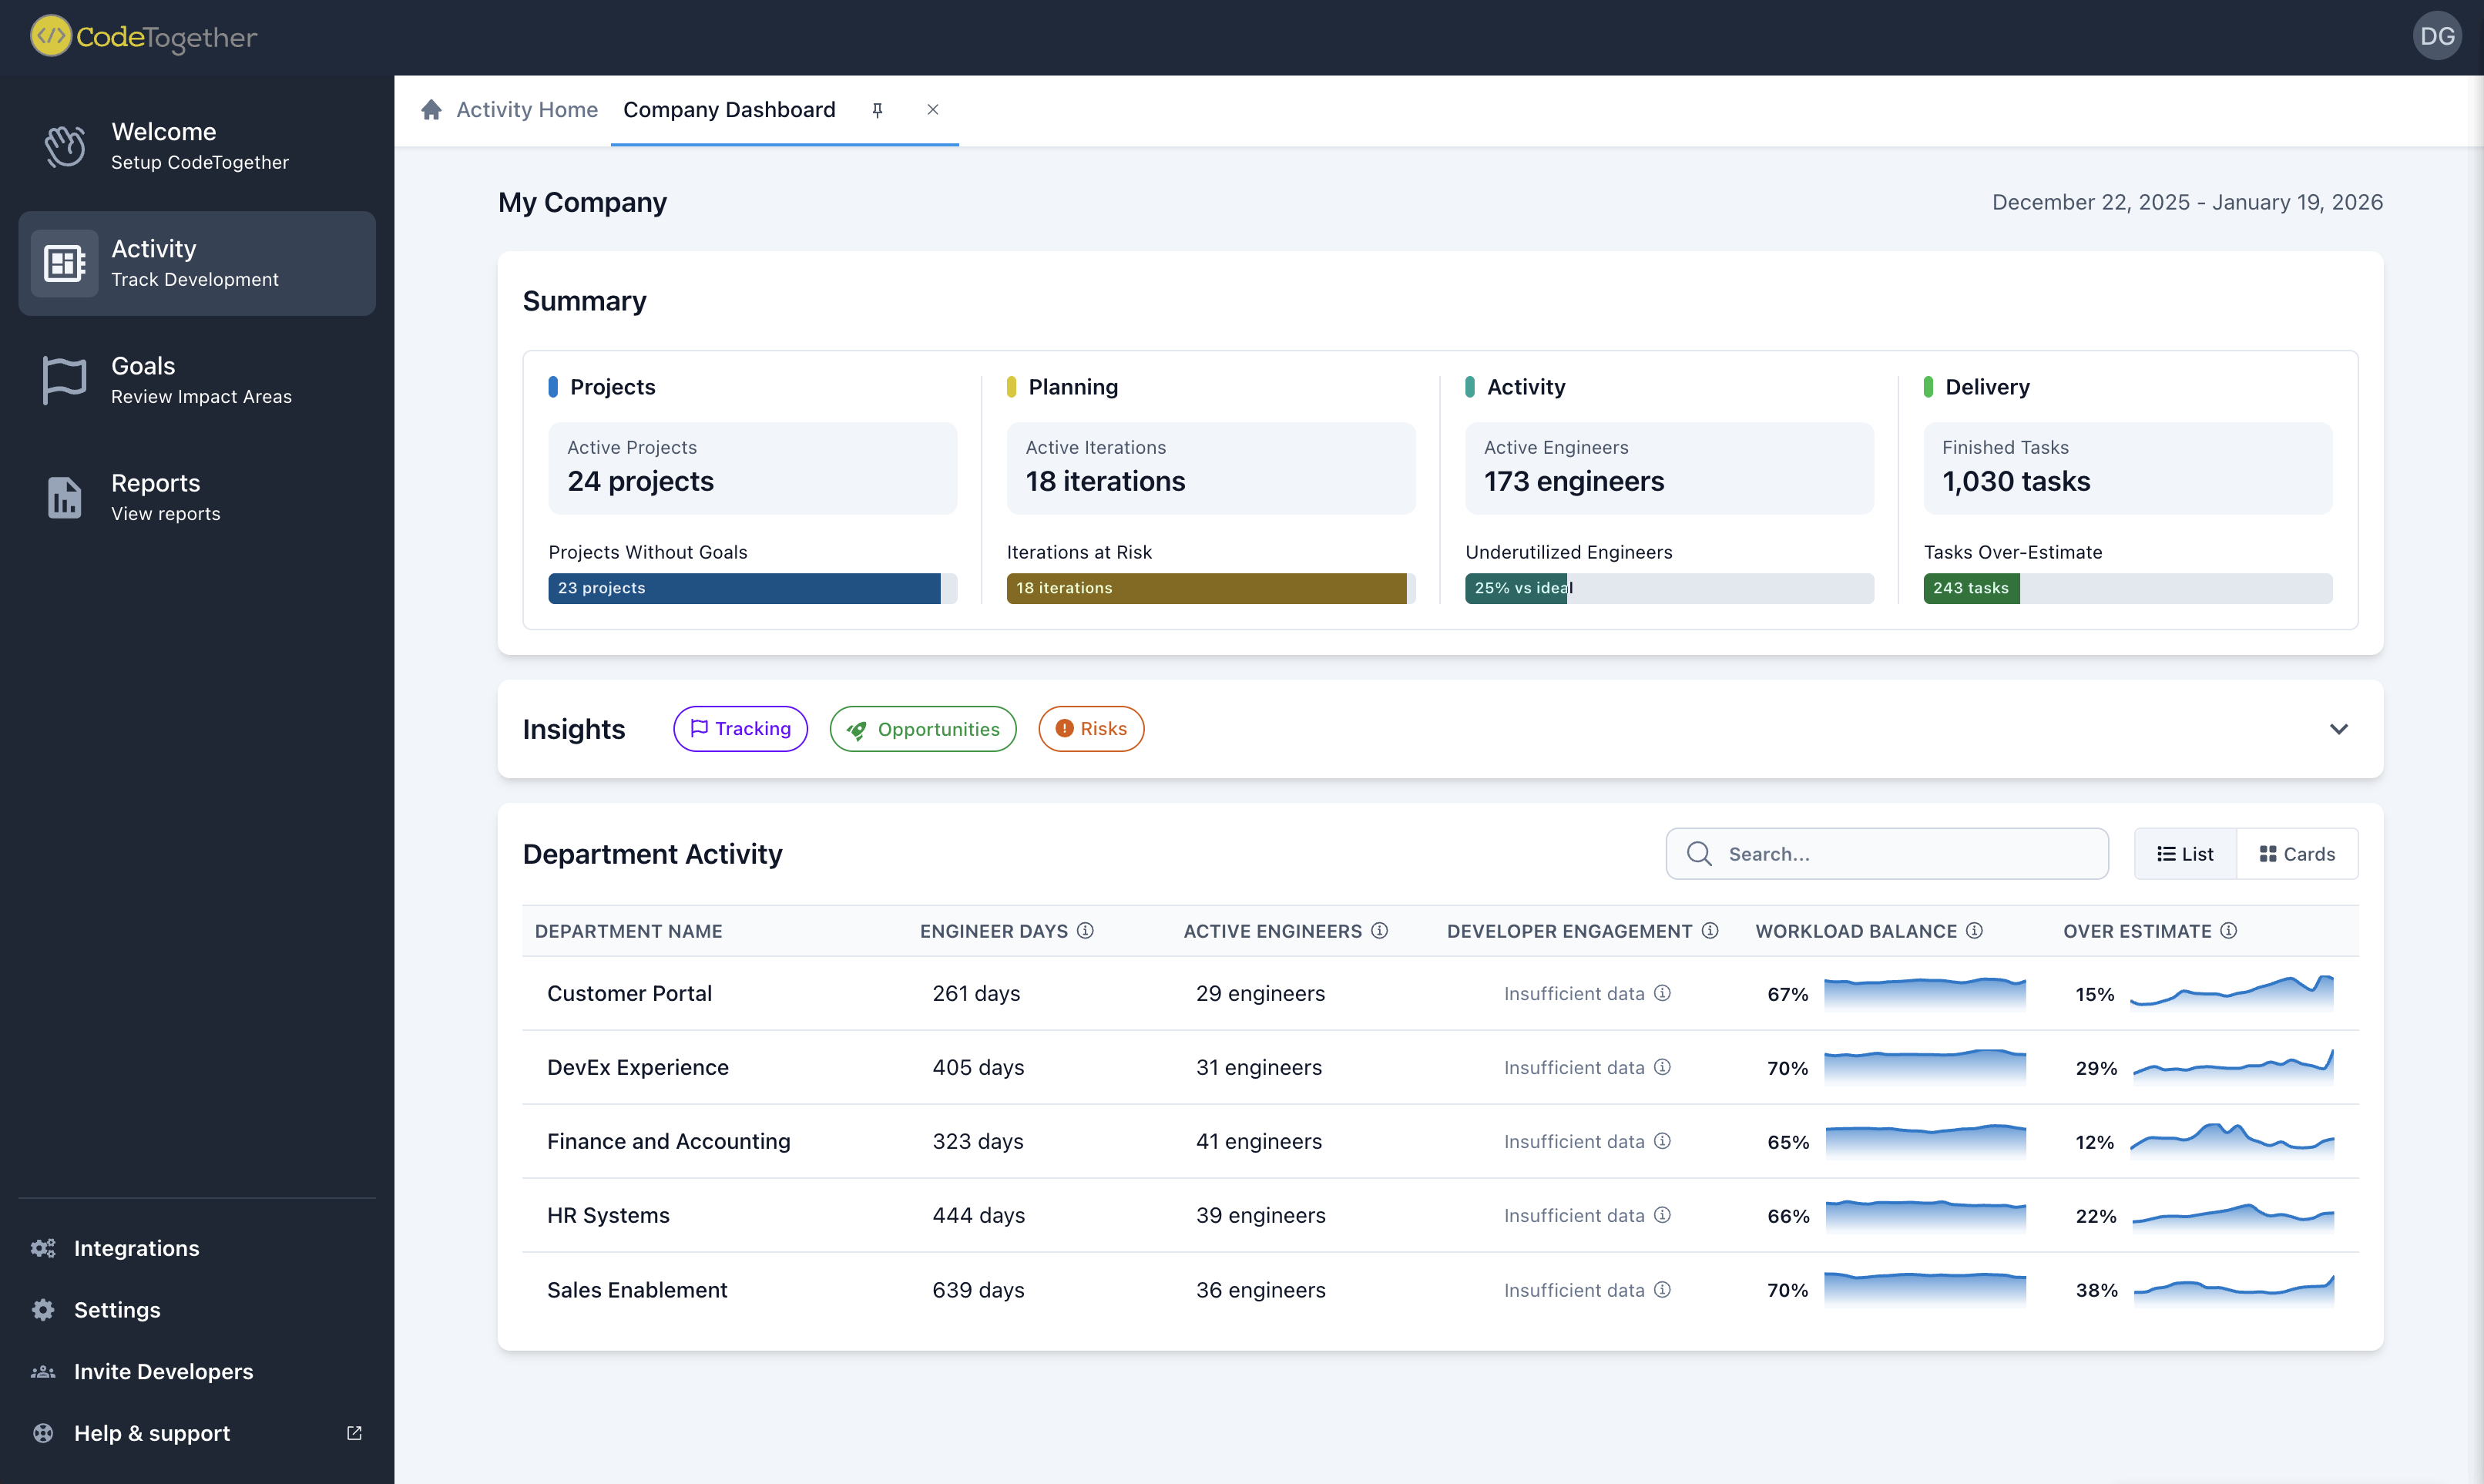
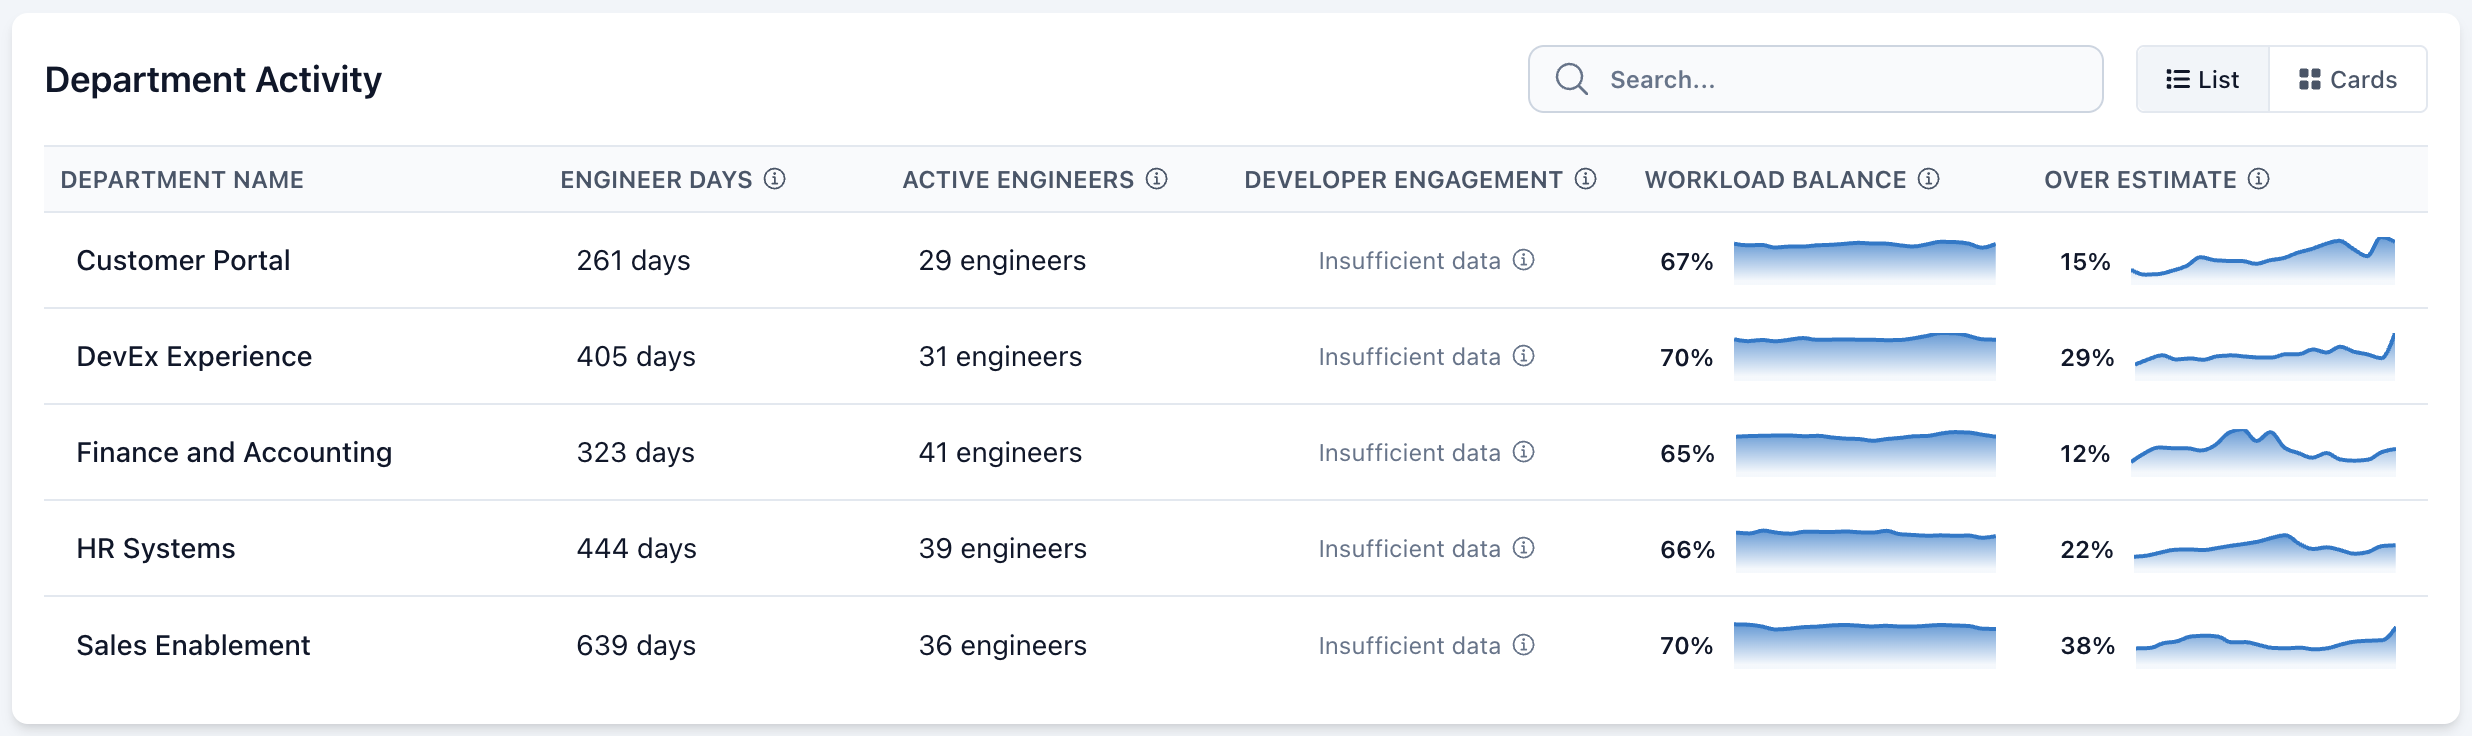
List Tab (Company & Department Pages)
The List Tab is available on Company and Department pages, offering a structured overview of engineering activity:
Company View – Displays a breakdown by department, including:
- Engineer Days
- Active Engineers
- Engagement Rate
- Over Estimate Rate Click on a department to view detailed activity.
Department View – Displays a breakdown by project, including:
- Engineer Days
- Active Engineers
- Engagement Rate
- Over Estimate Rate Click on a project to explore its metrics.
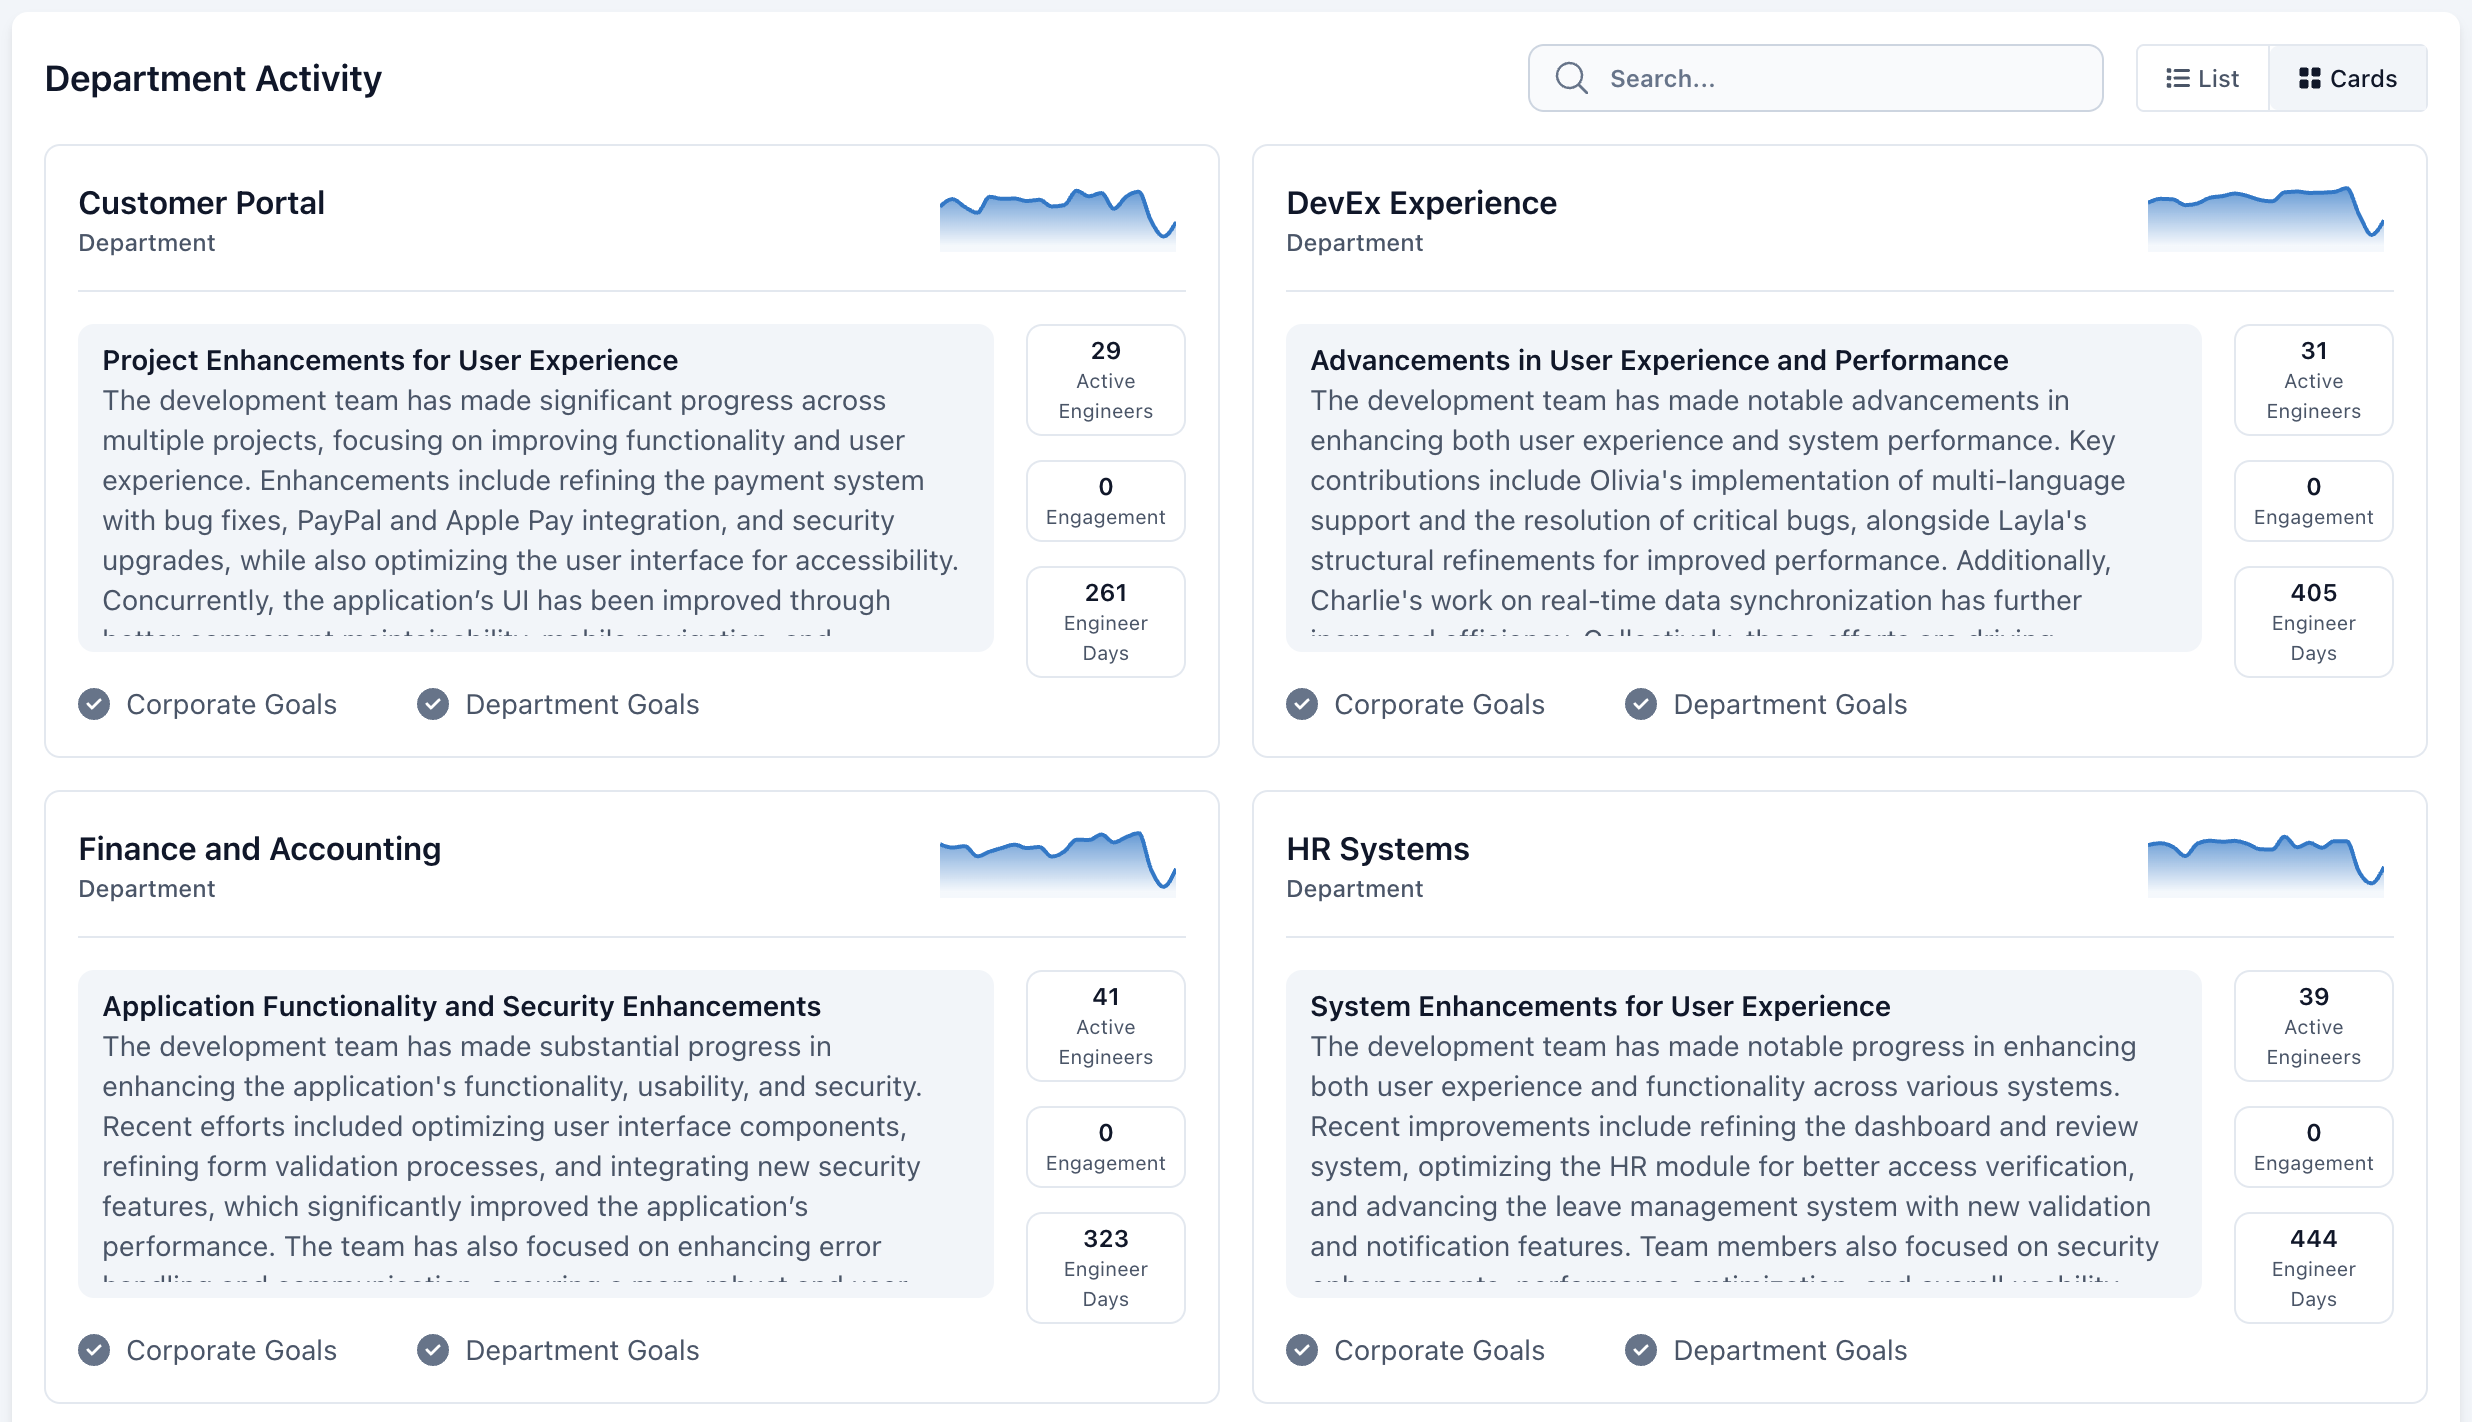
Cards Tab (Company & Department Pages)
The Cards tab presents a card grid with engineering activity. Each card includes a graph to easily spot trends, an AI-generated summary of recent activity, and key metrics.
The metrics shown depend on the page type:
- Company—Displays the breakdown by department. Includes Active Engineers, Engagement Rate, and Engineer Days. Click a department to view its activity.
- Department—Displays the breakdown by project. Includes Active Engineers, Engagement Rate, and Engineer Days. Click a project to view its activity.
- Project—Displays the breakdown by developer. Includes Active Tasks, Finished Tasks, and Engineer Hours. Click a developer's name to view their work log.
Additionally, when viewing Company or Department pages, a status indicator shows goal progress. On Project pages, the dashboard displays a visual representation of the component workload.
Use the Search bar to quickly locate an item.
Tasks Tab (Project Pages Only)
The Tasks tab tracks individual work items, displaying time spent on tasks along with code additions and deletions. For deeper context, click a task to view the Task Work Log.
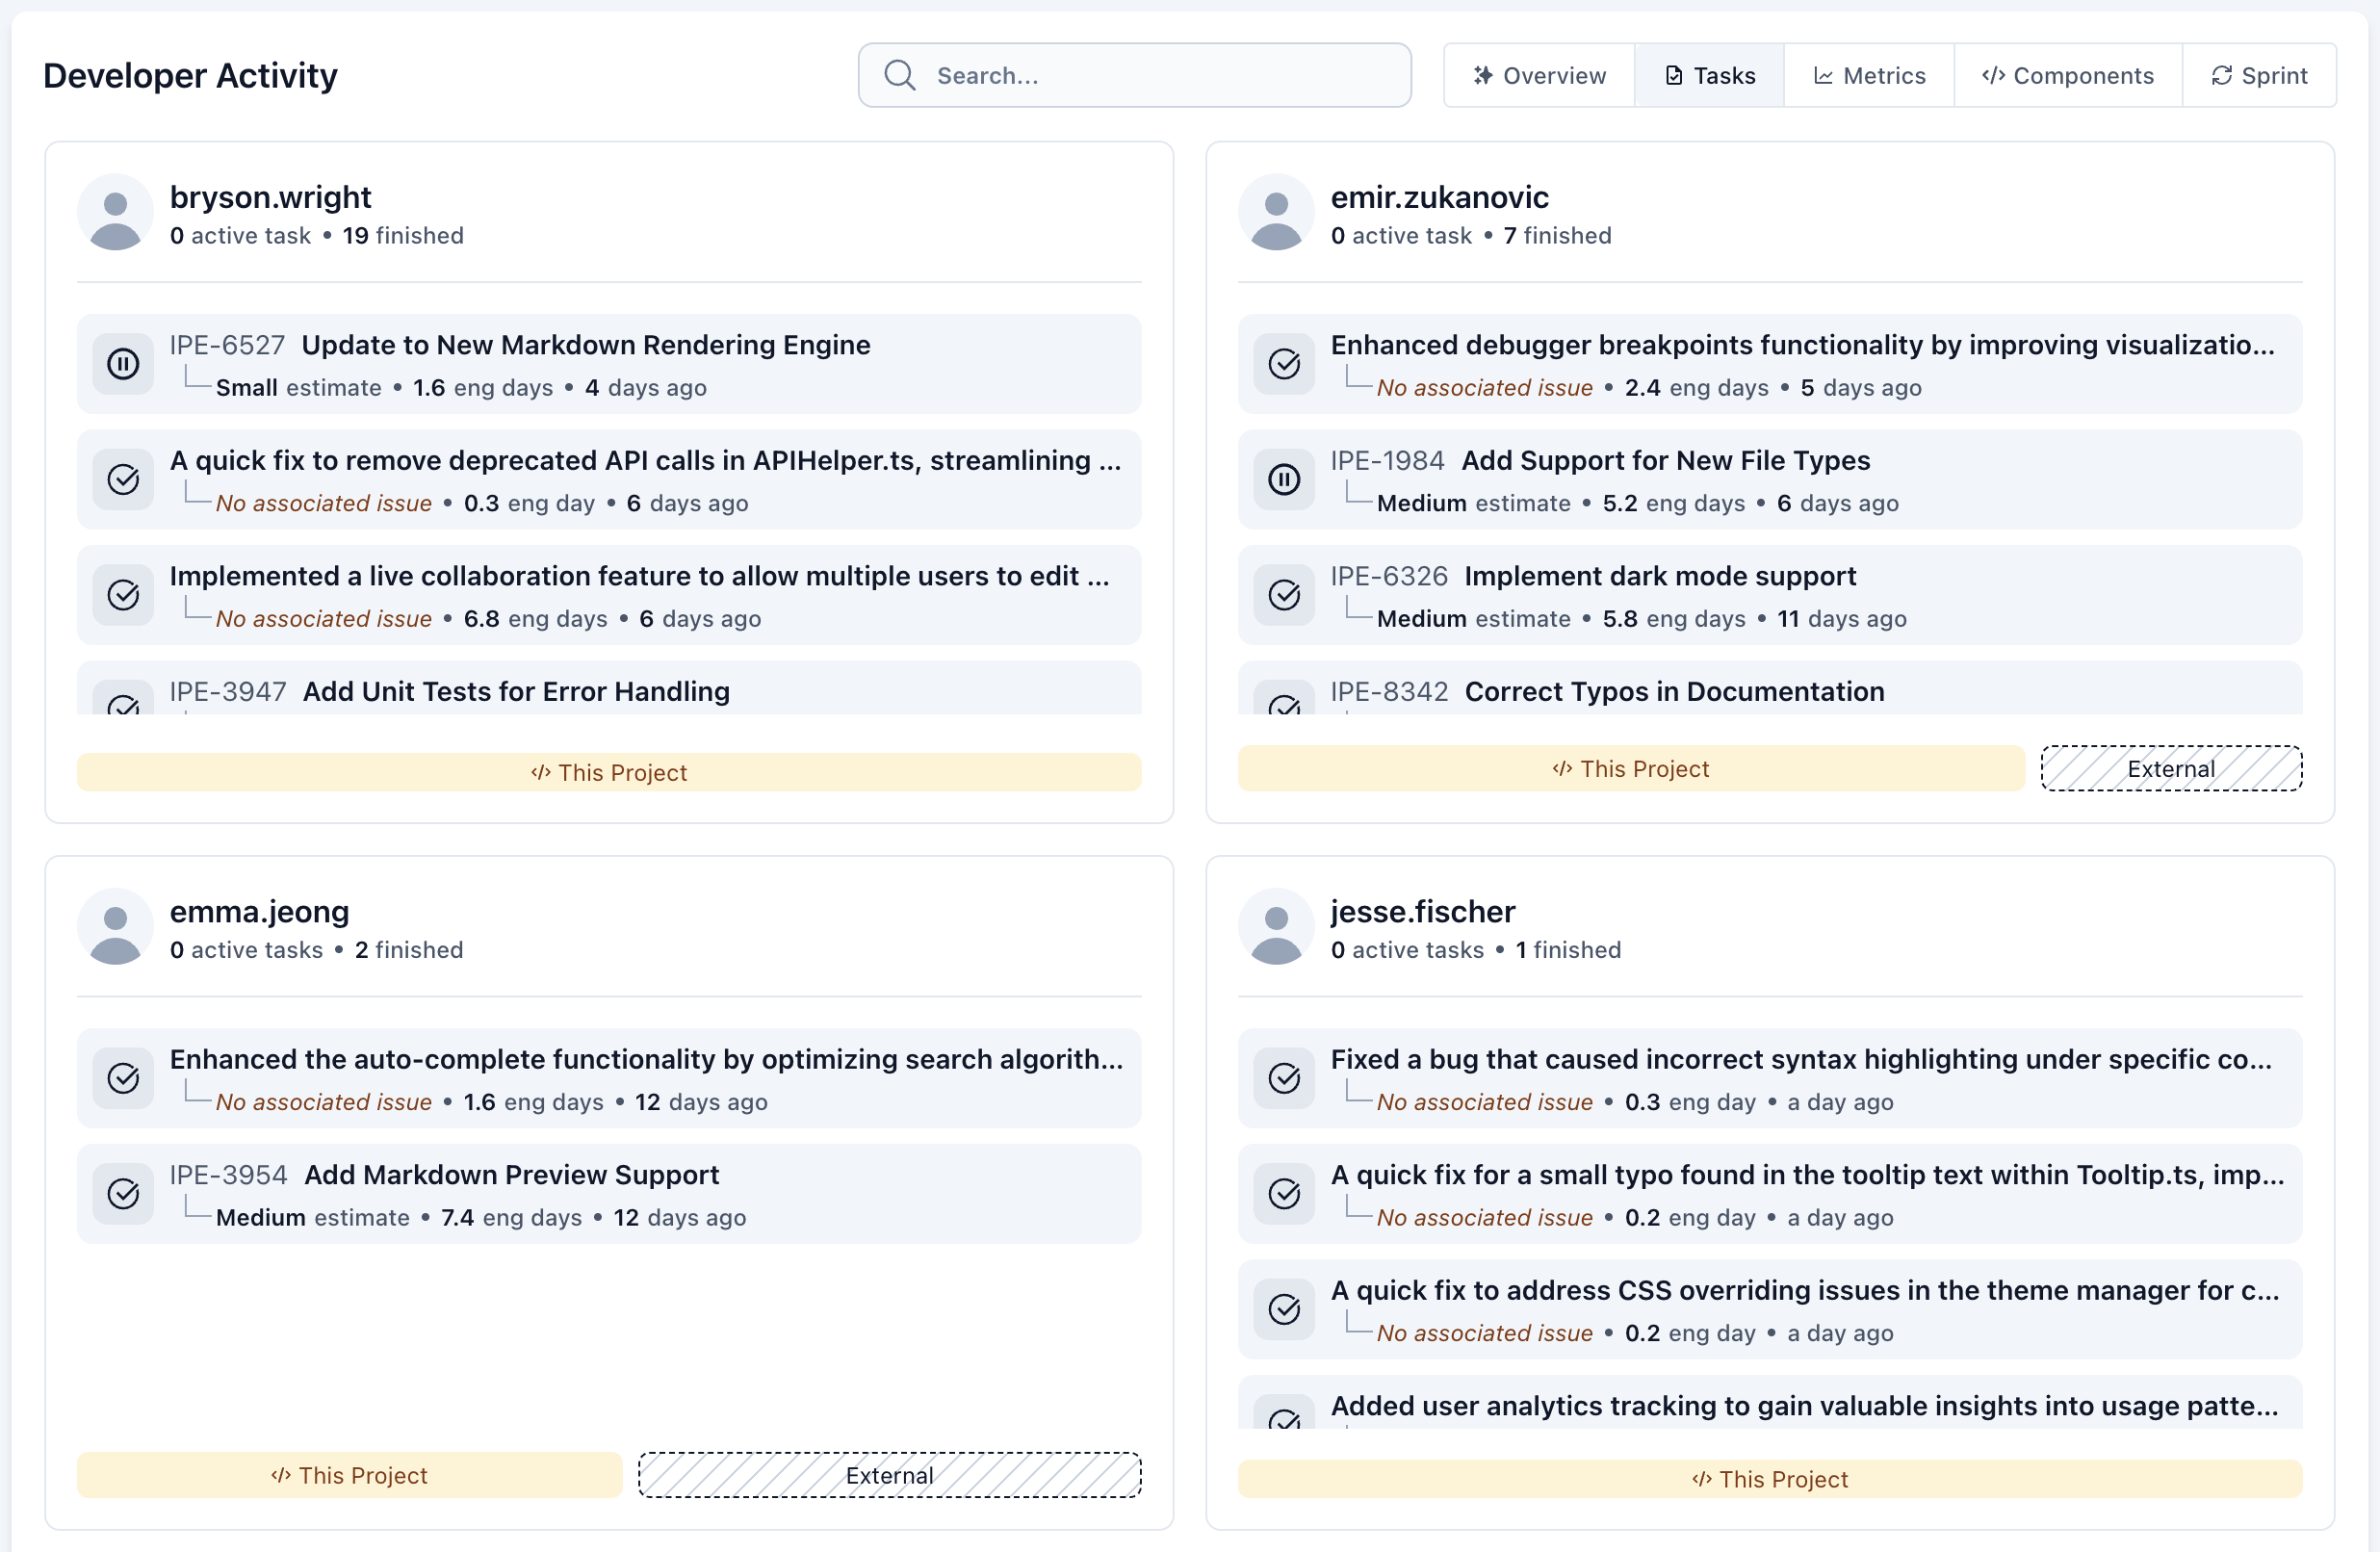
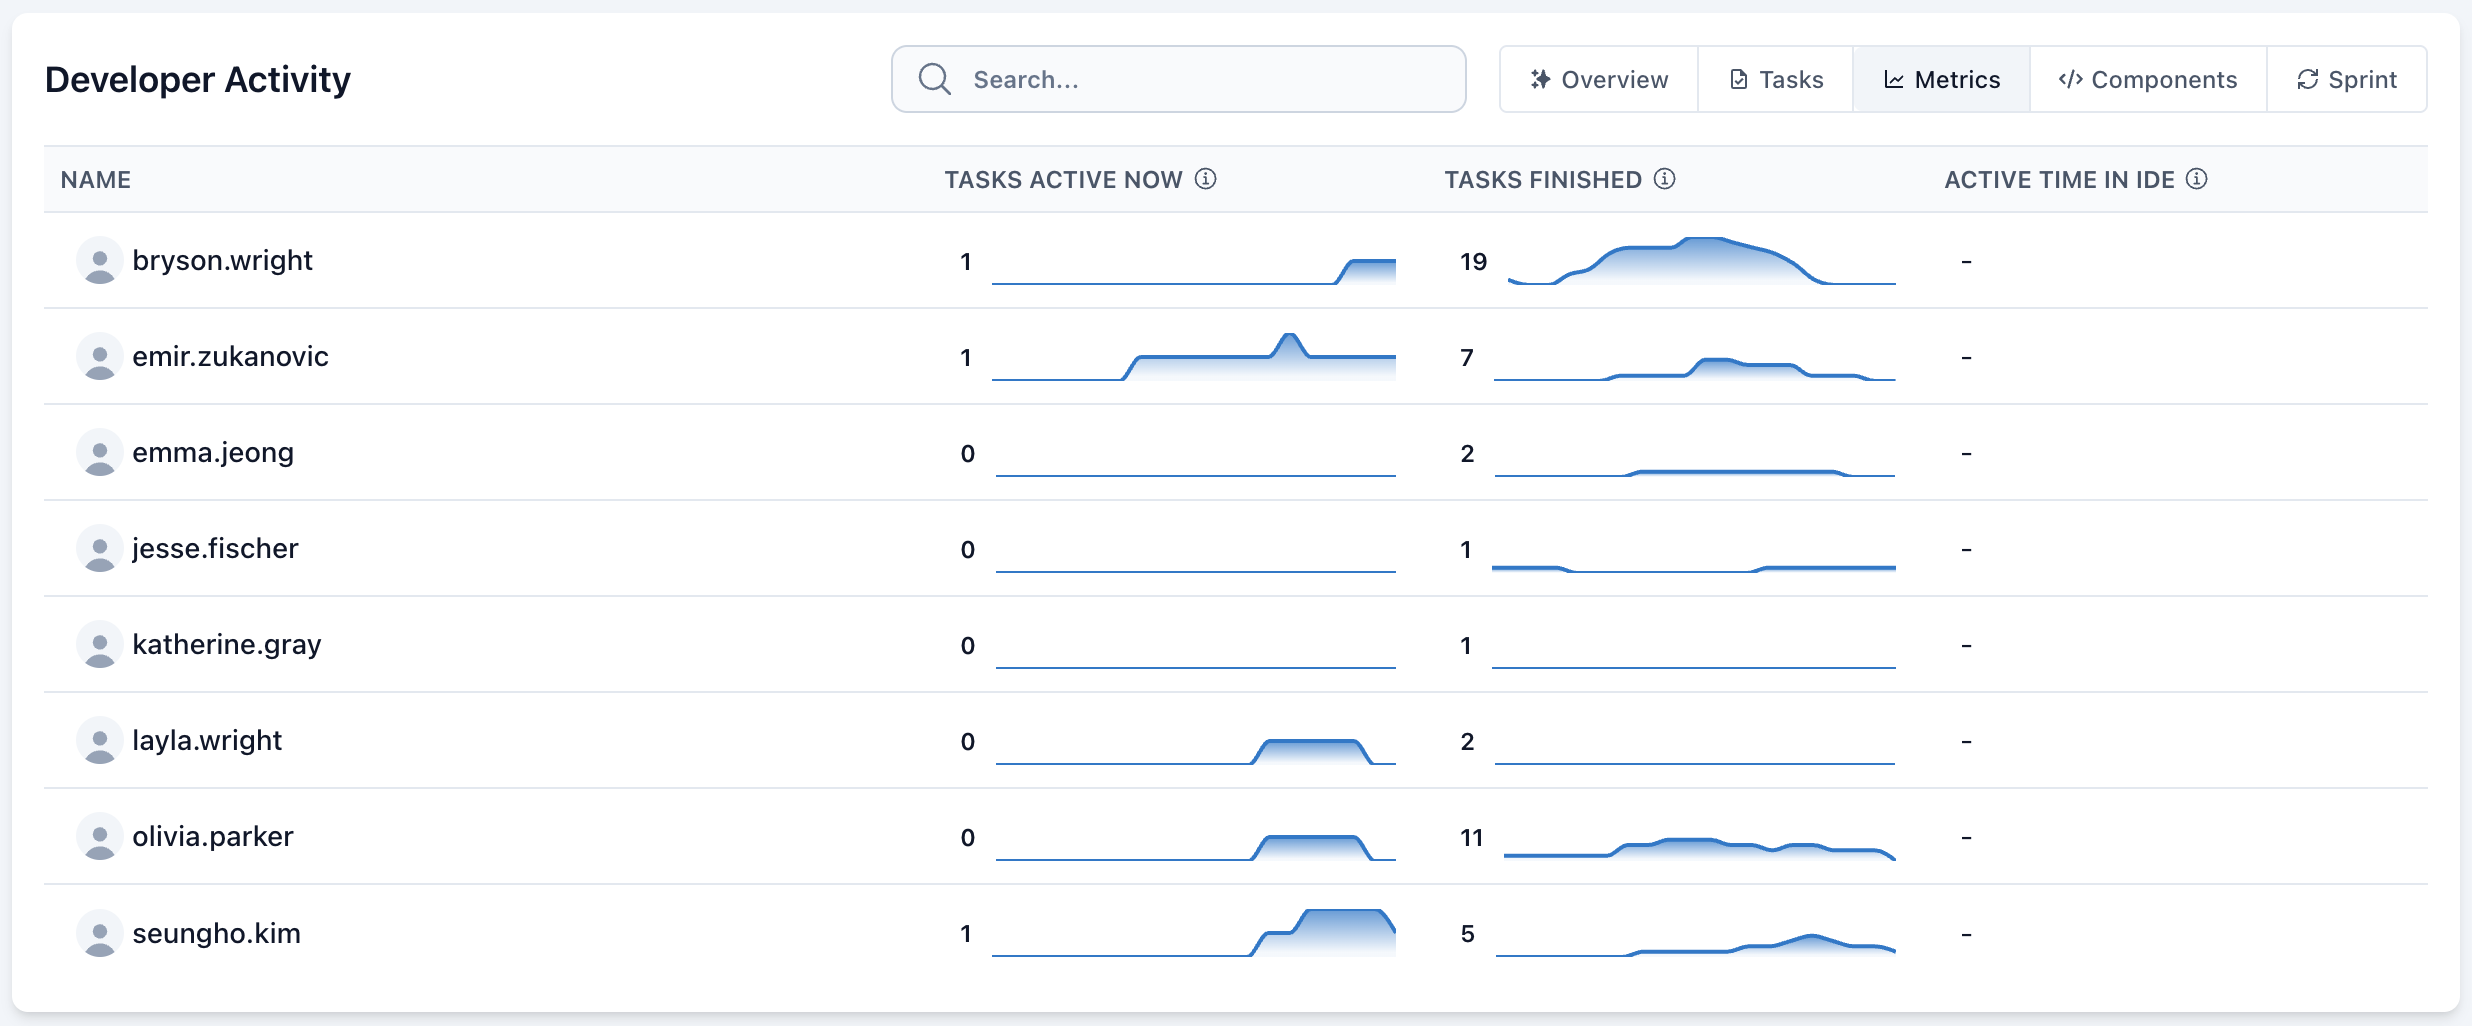
Metrics Tab (Project Pages)
- Task-level details grouped by developer
- Metrics such as:
- Active Tasks
- Finished Tasks
- Engineer Hours Click on a developer’s name to access their work log.
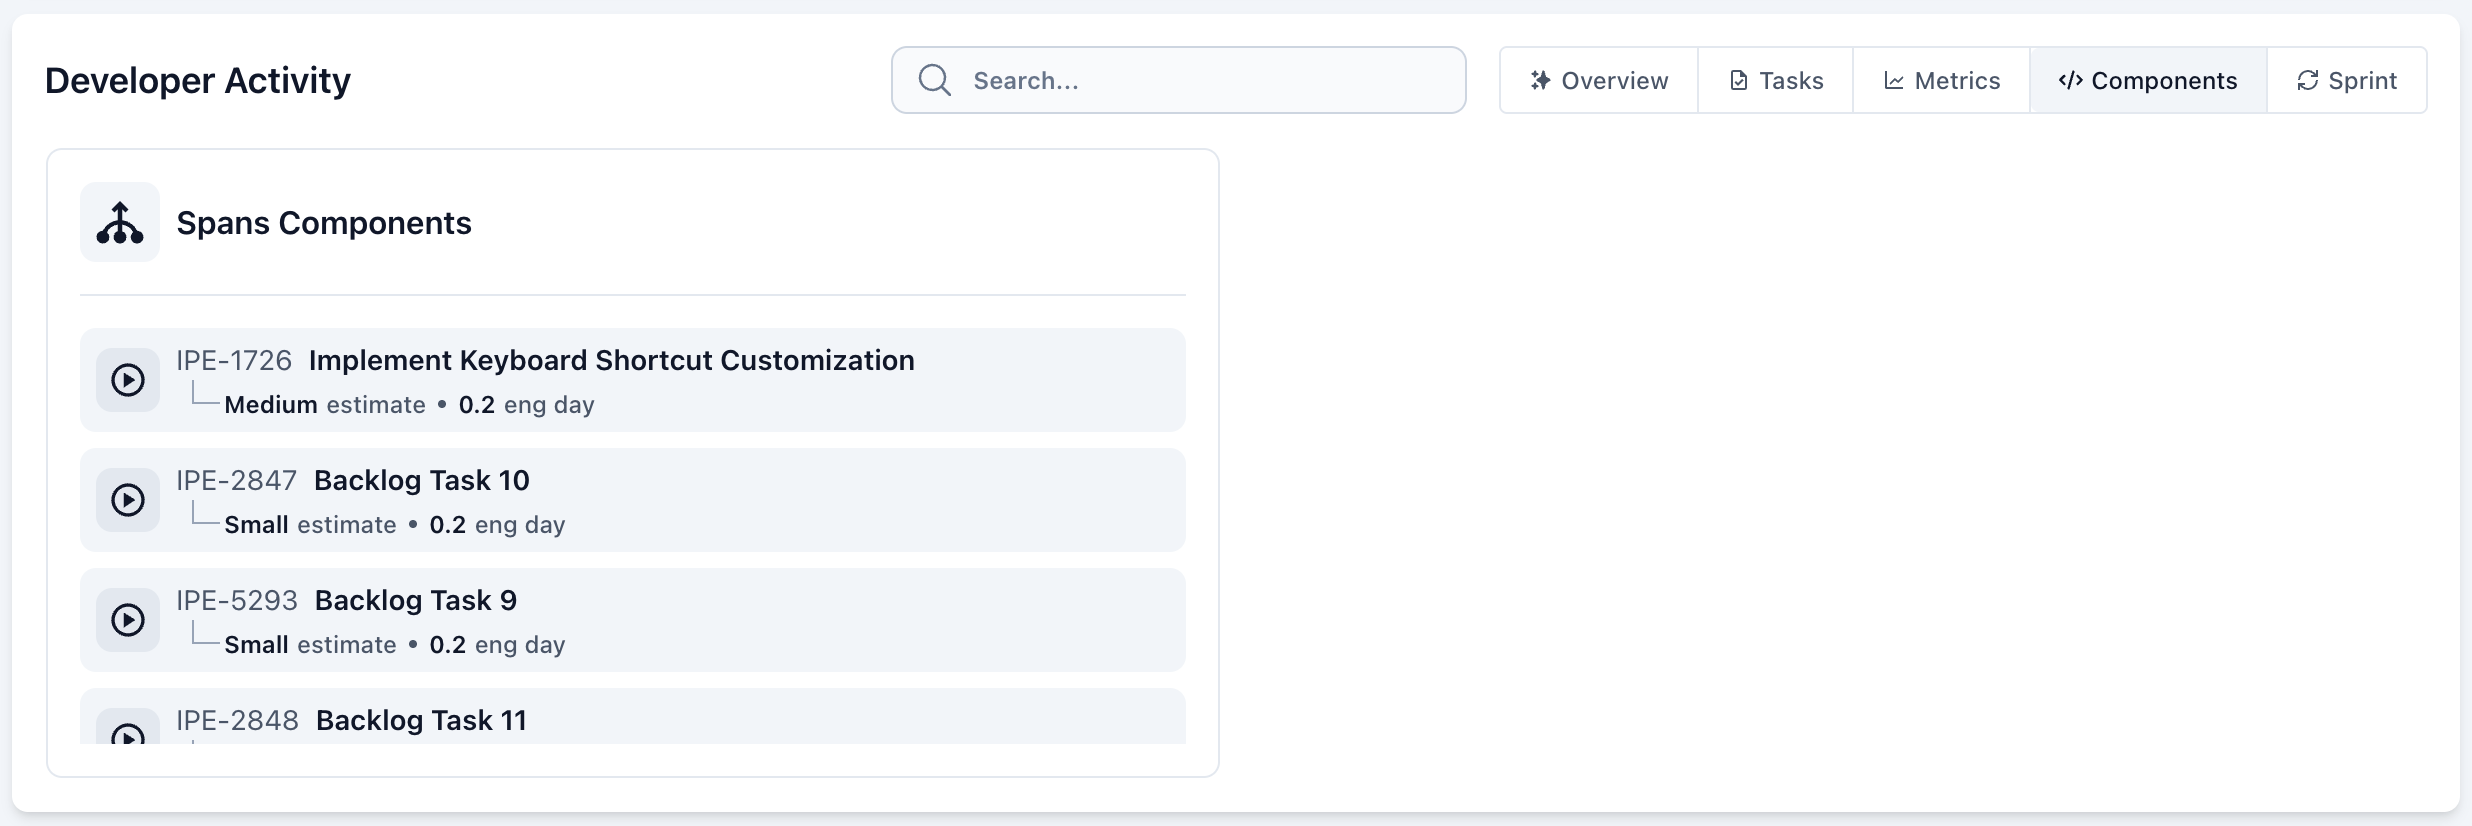
Components Tab (Project Pages Only)
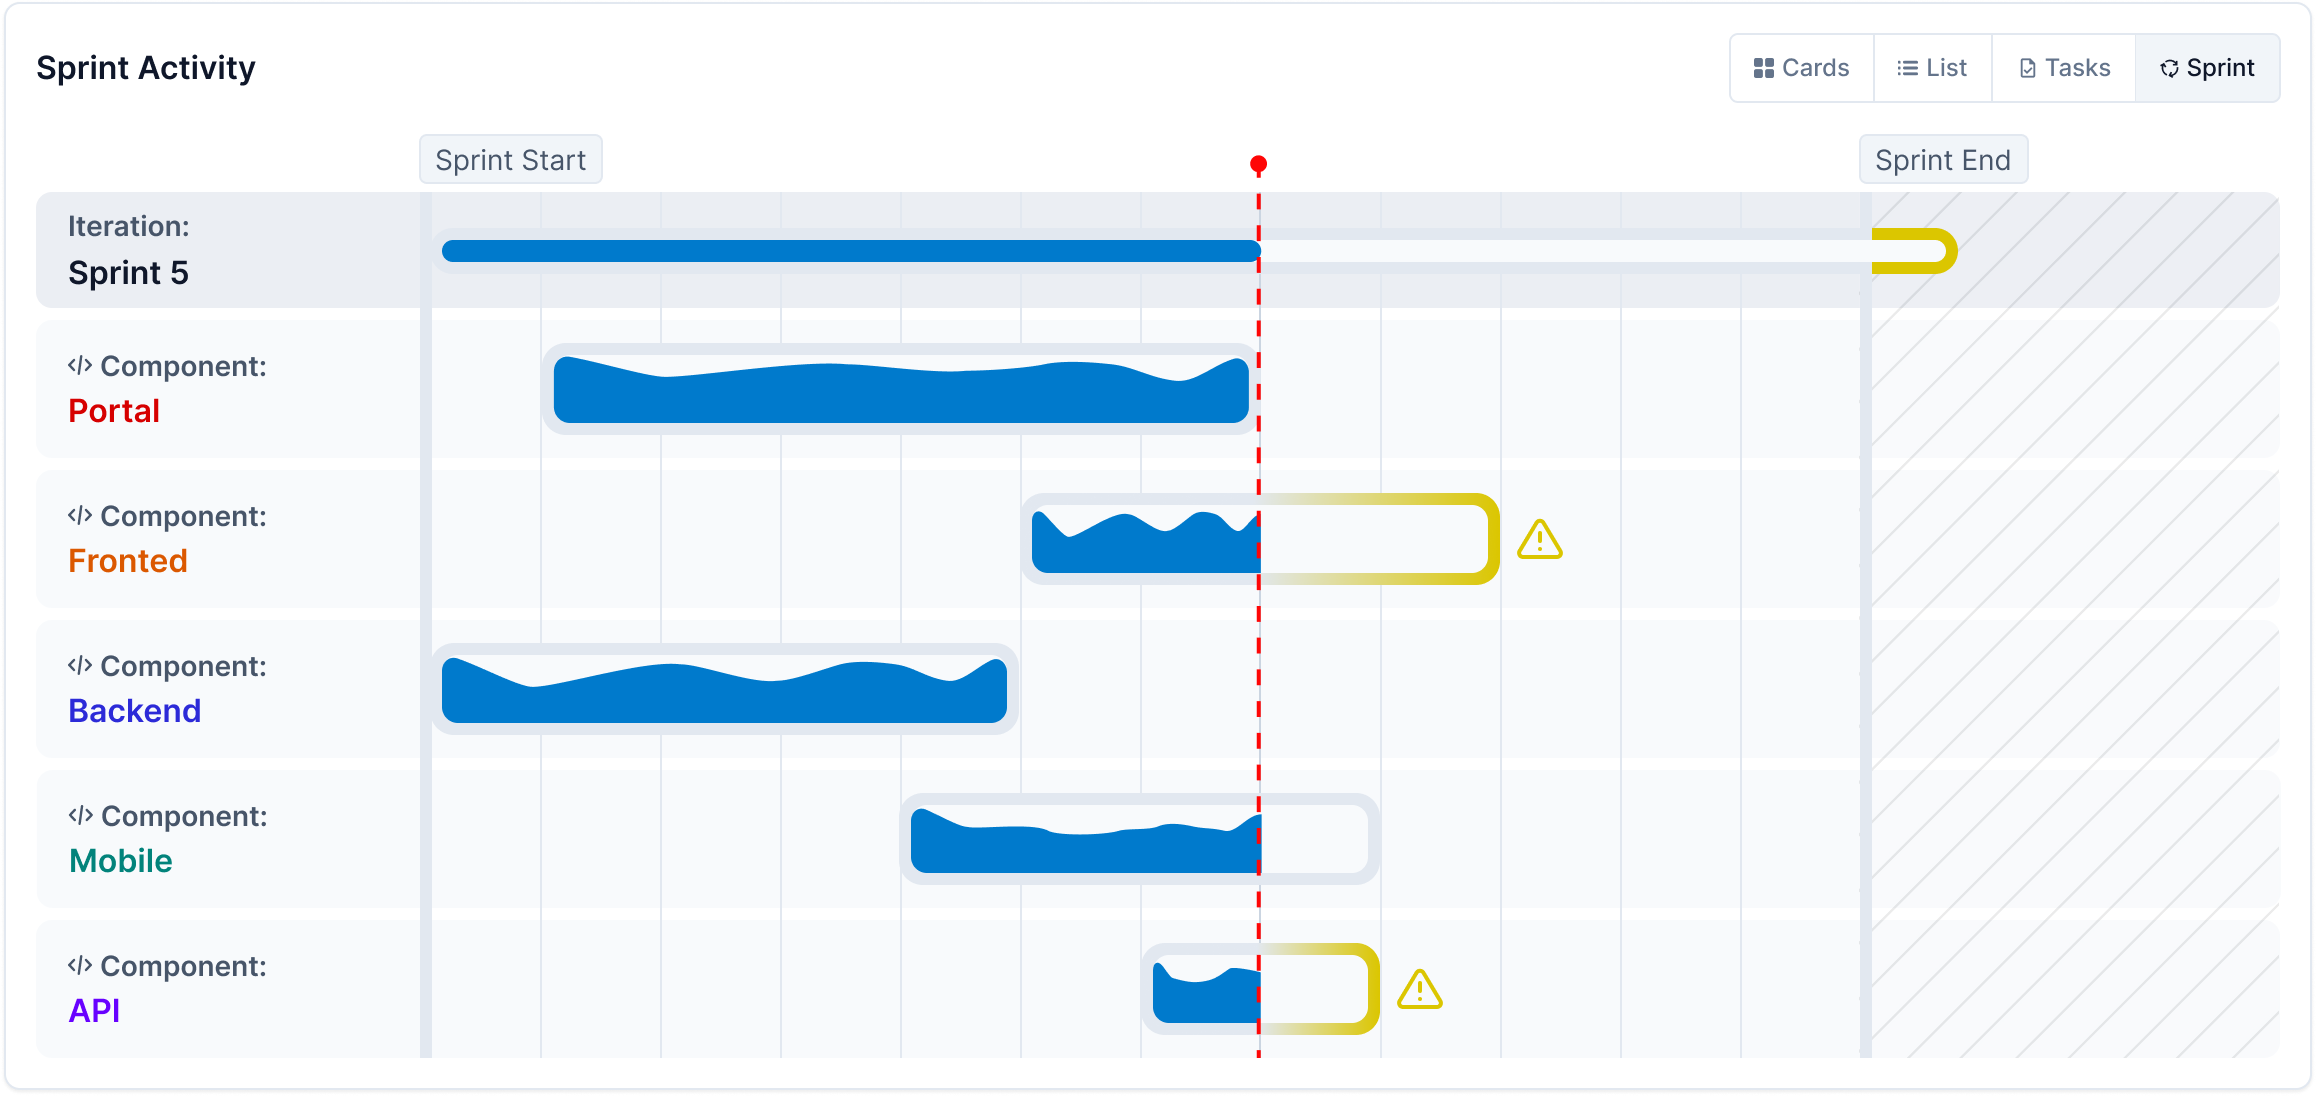
Iteration Tab (Project Pages Only)
The Iteration tab—named according to the current iteration type (e.g. Sprint, Milestone)—offers a timeline-based view of ongoing work, with task activity organized by component.
Key features:
- Visual Indicators: Yellow shading highlights missed targets for quick identification.
- Proactive Warnings: Alerts you when an iteration is at risk of exceeding its scheduled end date.
- Activity Graphs: Tracks task engagement over time, helping you spot slowdowns or inactivity.
For additional context, click on any component to view its Component Work Log.