Insights & Risks
Insights on the dashboard automatically surface noteworthy patterns and potential risks.
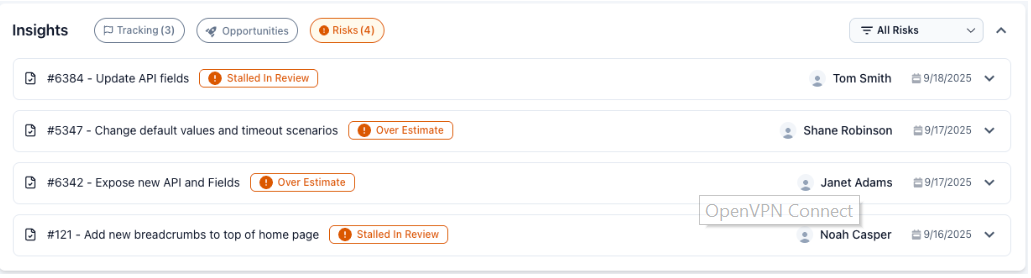
As CodeTogether identifies risks, they are clearly highlighted in the Risks area under Insights.
The system automatically flags outliers—for example, when a task is taking significantly longer than estimated or when other productivity risks emerge—so teams can react and adjust plans proactively to improve workflow and outcomes.
Risk categories
Insights are grouped to help you focus on what matters:
- Task Risks – Item-level risks tied to a specific task.
- Workflow Risks – Process-level risks spanning teams or multiple items.
- Hidden Risks – Risks that exist but are not shown due to privacy settings, role permissions, or visibility rules. They can be seen via Hidden Risks when your role allows it.
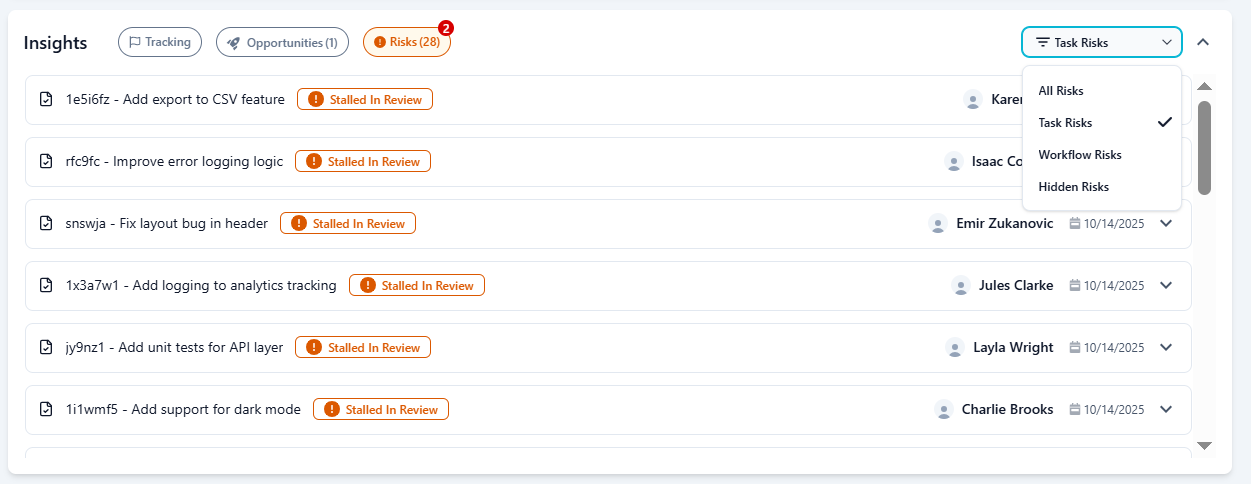
Filtering Risks
Use the filter in the top-right of the Insights panel:
- All Risks – Shows all risks you’re allowed to see.
- Task Risks – Only item-level risks.
- Workflow Risks – Cross-cutting/process risks.
- Hidden Risks – Risks hidden due to privacy/permissions; visible when your role allows it.
The red badge next to Risks indicates the number of currently flagged risks.
Risk catalog
| Risk | Description | Example |
|---|---|---|
| Stalled in Review | Tasks stuck in code review beyond the stalled threshold. | Task has been stalled in review for 7 days. |
| Stalled Task | No active coding/commits beyond the stalled threshold. | No coding activity for 3 days on task CT-214. |
| Over Estimate | Tasks that exceeded their original estimate. | Task took 3.9 eng days longer than expected. |
| Estimate Nearly Reached | Remaining estimate is nearly exhausted for the task. | Task has 0.1 eng day left before hitting the estimate. |
| No Estimate | Tasks created without an initial estimate. | 7% of new tasks last month have no estimate. |
| Heavy Code Churn | Churn far above baseline, indicating rework/instability. | Churn ratio 11.06× vs target 0.5×. |
| Over Time Work | Engineer working consistently above target daily hours. | Avg. +0.8h over target in the last week. |
| Not Connected | Engineer is not connected/recently inactive in the system. | No recent activity; please check IDE connection. |
| Unhealthy Goal | A goal is trending unhealthy based on progress vs. plan. | Goal ‘Search Revamp’ behind on milestones. |
| Project Behind on Goal | Project’s goal health is off track versus planned target. | Project Alpha is behind on Q4 completion target. |
| Department Behind on Goal | Department goal health is off track versus plan. | Frontend dept. behind on delivery goal for this quarter. |
| Goal Off-Track | Container-level goal (e.g., portfolio) is off-track. | Portfolio ‘Modernization’ off-track vs. baseline. |
| Iteration At Risk | Current iteration is at risk due to delays/blocks/overload. | 2 of 5 active iterations marked at risk. |
| Project Iteration At Risk | Project’s iteration is at risk (parameterized label). | Project Sprint 12 at risk due to review bottlenecks. |
Examples
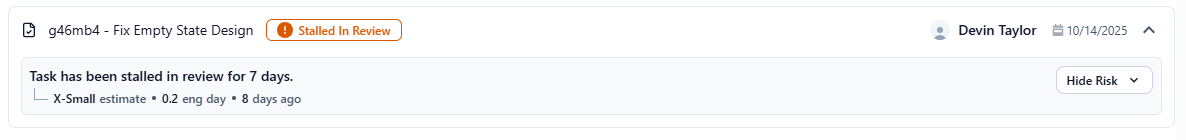 Stalled in Review — “Task has been stalled in review for 7 days.”
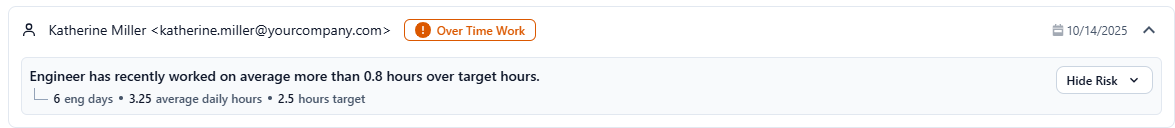 Over Time Work — “Engineer has recently worked on average more than 0.8 hours over target hours.”
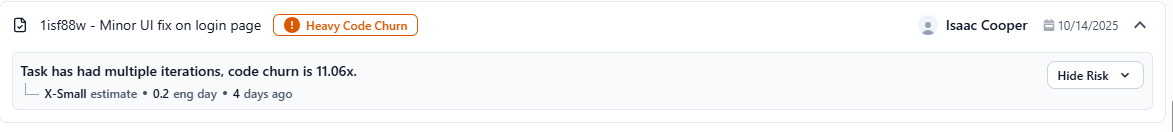 Heavy Code Churn — “Task has had multiple iterations, code churn is 11.06x.”
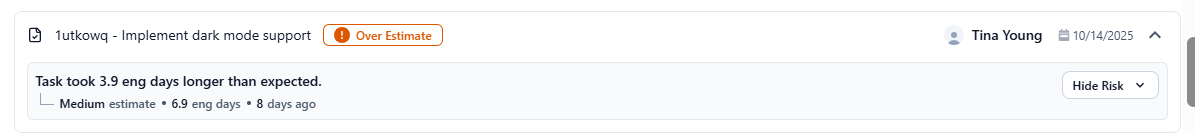 Over Estimate — “Task took 3.9 eng days longer than expected.”