Metrics
This section provides key company, department, and project-level metrics that measure activity, efficiency, and progress across tasks, iterations, and projects. These indicators help track how time is spent, how work is distributed, and how productivity aligns with estimates and goals.
note
Some metrics are configurable (e.g. code churn, average daily hours, churn multiplier, exploration hours) and can be adjusted in the System Tuning parameters
The visibility of specific metrics can be managed through System Privacy Settings, while other metrics are reported as raw activity counts. 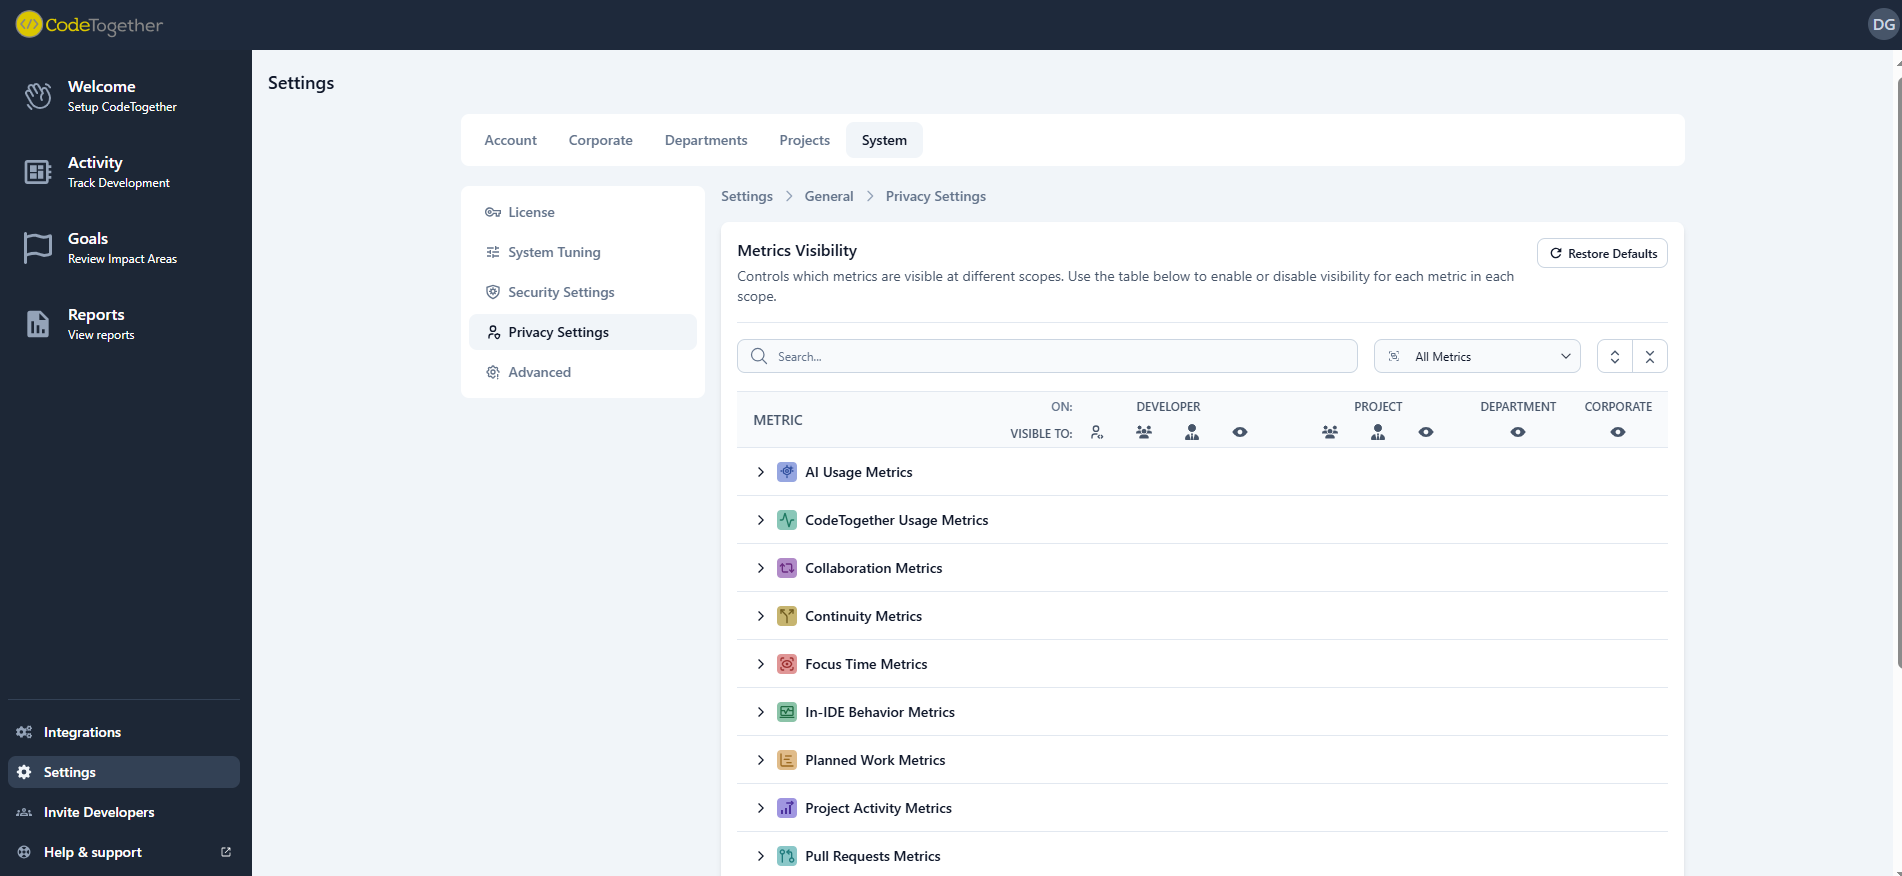
The following table lists all available metrics with their descriptions, examples, and the levels (company, department, project) where each metric can be accessed.
AI Metrics
| Metric | Description | Example | Available At |
|---|---|---|---|
| Code from AI | Measures the direct contribution of AI tools to the codebase. High values indicate strong leverage of AI assistants, potentially accelerating development velocity. Monitoring this ensures AI tools are being utilized effectively to augment human effort rather than replacing critical thinking. | 12% | Company, Department, Project |
| Code from Human | Represents the manual coding effort contributed by developers. While AI adoption is encouraged, a healthy balance of human-authored code ensures complex logic and architectural decisions remain under human oversight. This metric helps track the evolving role of developers as they transition to AI-assisted workflows. | 88% | Company, Department, Project |
| Overall Usage | Tracks the breadth of AI tool adoption across the engineering organization. It identifies how widespread the technology is, helping leaders gauge the return on investment for AI licenses. Consistent usage suggests successful integration into the daily workflow. | 250 AI-assisted changes | Company, Department, Project |
| Daily Usage | Identifies the core group of power users who have integrated AI into their everyday habits. High daily usage signals deep adoption and reliance on these tools for routine tasks. This cohort often drives best practices and can mentor others in maximizing AI utility. | 40% | Company, Department, Project |
| Infrequent Usage | Highlights potential adoption gaps or resistance to new tooling within the team. Identifying infrequent users allows for targeted training or investigation into tooling friction. Addressing these gaps ensures equitable access to productivity enhancements across the organization. | 60% | Company, Department, Project |
CodeTogether Usage Metrics
| Metric | Description | Example | Available At |
|---|---|---|---|
| IDE Plugin Adoption | Measures the deployment and activation of the CodeTogether plugin across the engineering team. High adoption is critical for capturing accurate, high-fidelity metrics directly from the IDE. Gaps here represent blind spots in the organization's data visibility. | 85% | Company, Department, Project |
| Projects With Goals | Indicates the alignment of development efforts with specific, measurable objectives configured in the platform. Projects with defined goals allow for more precise tracking of progress and efficiency. This metric encourages a results-oriented approach to development management. | 6 projects | Company, Department, Project |
| Projects Without Goals | Highlights projects operating without specific performance targets or efficiency benchmarks. These areas may lack the strategic context needed to optimize workflows effectively. Setting goals for these projects is a key step toward data-driven improvement. | 2 projects | Company, Department, Project |
| Projects Registered | Tracks the total number of distinct projects being monitored. This provides a sense of the scale and scope of the tracked engineering landscape. It serves as a baseline for understanding the breadth of data collection. | 12 projects | Company, Department |
| Tracking Coverage | Quantifies the reliability of the data by measuring the portion of commits linked to tracked activity. Low coverage suggests work is happening outside of monitored environments or configuration issues. Improving this ensures that insights are based on a complete picture of development activity. | 75% | Company, Department, Project |
CodeTogether Usage Metrics
| Metric | Description | Example | Available At |
|---|---|---|---|
| Sessions | Reflects the frequency of real-time collaborative problem-solving events. Frequent sessions often indicate a healthy culture of pair programming and knowledge sharing. However, excessive impromptu sessions might signal a need for better documentation or clearer requirements. | 45 sessions | Company, Department, Project |
| Weekly Hours | Quantifies the time investment in synchronous collaboration. While collaboration drives quality, tracking hours helps ensure it doesn't crowd out deep work time. This balance is crucial for maintaining both team alignment and individual productivity. | 18 hours | Company, Department, Project |
| Participants | Measures the breadth of engagement in collaborative efforts across the team. A high number of participants suggests a cohesive unit where knowledge is shared freely. As participant counts are mased on each session, this metric helps indicate if sessions are mainly 1-on-1 vs. in larger sessions. | 3.2 participants per session | Company, Department, Project |
Continuity Metrics
| Metric | Description | Example | Available At |
|---|---|---|---|
| PRs Stalled Now | Identifies bottlenecks in the review process where work is waiting for feedback. Stalled PRs increase cycle time and delay value delivery to customers. Reducing this number improves flow and prevents context-switching costs for the original author. | 2 PRs | Company, Department, Project |
| Recently Stalled | Highlights work that began but was abandoned or paused before reaching the review stage. This often signals unclear requirements, shifting priorities, or unexpected technical blockers. Addressing these stalls reduces wasted engineering effort and improves predictability. | 2 PRs | Company, Department, Project |
| Coding Stalled Now | Pinpoints tasks that are actively in development but have seen no recent progress. This is an early warning system for developers who may be stuck or blocked. Early intervention here can prevent minor delays from becoming missed deadlines. | 2 tasks | Company, Department, Project |
| Task Time | Measures the typical duration required to complete a unit of work. Consistent, manageable task times suggest well-sized stories and a predictable delivery cadence. Extremely long task times often indicate scope creep or excessive complexity that should be decomposed. | 1 day | Company, Department, Project |
Focus Time Metrics
| Metric | Description | Example | Available At |
|---|---|---|---|
| Active Time in IDE | Tracks the raw time engineers spend interacting with the development environment. It serves as a baseline for capacity planning and understanding overall engineering bandwidth. This metric distinguishes between meeting-heavy days and days dedicated to technical execution. | 0.7 days | Company, Department, Project |
| Flow State | Measures the time spent in deep, uninterrupted concentration, which is essential for complex problem solving. Maximizing flow state is the single most effective way to boost developer productivity and happiness. Low flow time indicates an environment rife with distractions that need to be managed. | 0.1 days | Company, Department, Project |
| Flow Interruptions | Quantifies the frequency with which deep work sessions are broken by external factors. High interruption rates destroy productivity and increase cognitive load. Identifying and reducing these interruptions is key to fostering a high-performance engineering culture. | 0.12 days | Company, Department, Project |
| Time to Flow State | Measures the friction involved in settling into a productive coding session. A long ramp-up time suggests tooling issues, slow environments, or high cognitive overhead. Minimizing this time ensures that when developers sit down to work, they can become productive immediately. | 0.1 days | Company, Department, Project |
In-IDE Behavior Metrics
| Metric | Description | Example | Available At |
|---|---|---|---|
| Coding | Isolates the time spent actively writing and modifying code, representing the core implementation phase. Balancing this with exploration and testing ensures that code is not just written quickly, but written correctly and with sufficient context. | 123.2 hours | Company, Department, Project |
| Debugging | Reflects the effort spent troubleshooting and fixing issues within the IDE. While necessary, excessive debugging on specific projects can signal technical debt or fragility. Monitoring this helps identify areas of the codebase that may require refactoring. | 34.4 hours | Company, Department, Project |
| Exploration | Captures the time spent reading and navigating code to understand logic and dependencies. High exploration time is common in complex legacy systems or during onboarding. Reducing this through better documentation and code clarity accelerates the time-to-value for new features. | 90 hours | Company, Department, Project |
| Unit Testing | Tracks the investment in creating and running automated tests during development. A consistent focus on testing correlates with higher long-term stability and fewer regressions. It validates that speed is not being prioritized over quality. | 140 hours | Company, Department, Project |
| Collaboration | Measures time spent in live sharing or pair programming within the IDE context. This specific behavioral metric highlights the immediate, technical side of teamwork. It distinguishes between abstract communication and hands-on co-development. | 12.5 hours | Company, Department, Project |
Planned Work Metrics
| Metric | Description | Example | Available At |
|---|---|---|---|
| Work Estimate | Aggregates the total estimated effort for planned but not yet active work. This provides a view of the upcoming backlog size and resource requirements. Accurate backlog sizing is essential for realistic roadmap planning and expectation setting. | 34 days | Company, Department, Project |
| Pending Tasks | Counts the volume of distinct work items waiting in the queue. A growing backlog of pending tasks without corresponding throughput can signal a resource bottleneck. Monitoring this helps in balancing demand with available engineering capacity. | 12 tasks | Company, Department, Project |
Project Activity Metrics
| Metric | Description | Example | Available At |
|---|---|---|---|
| Active Iterations | Tracks the current sprint or development cycles that are in progress. This provides high-level visibility into the organizational rhythm and active workstreams. It ensures that development efforts are structured and time-boxed effectively. | 4 iterations | Company, Department, Project |
| Active Projects | Counts the number of projects receiving active engineering attention. This helps leaders assess focus and identify if resources are spread too thin across too many initiatives. Consolidating active projects often improves velocity and focus. | 2 projects | Company, Department, Project |
| Idle Projects | Identifies repositories or projects that have stagnated without recent activity. This can highlight abandoned initiatives or maintenance risks where code is aging without oversight. Archiving or reviving these projects cleans up the operational landscape. | 2 projects | Company, Department, Project |
| Iterations At Risk | Flags active sprints or cycles that are projected to miss their goals based on current velocity. Early detection of risk allows for scope adjustment or resource reallocation. This proactive metric moves management from firefighting to course-correction. | 2 iterations | Company, Department, Project |
Pull Request Metrics
| Metric | Description | Example | Available At |
|---|---|---|---|
| Acceptance Rate | Measures the efficiency of the review process by tracking how often code is merged versus rejected or reworked. A low acceptance rate indicates misalignment on requirements or quality standards. Improving this reduces churn and speeds up the delivery pipeline. | Acceptance Rate = 35 / 40 = 87.5% | Company, Department, Project |
| Review Time | Tracks the end-to-end time work spends waiting for peer review and approval. Long review times are a major drag on cycle time and can demoralize developers. Streamlining this process is often the quickest win for improving overall delivery speed. | 2.5 days | Company, Department, Project |
| PR Revisions | Counts the number of back-and-forth cycles required to get a PR merged. High iteration counts suggest ambiguous tasks or a lack of pre-review alignment. Reducing iterations through better spec definition improves both velocity and developer sentiment. | Average Review Iterations = 3.2 cycles per PR | Company, Department, Project |
Satisfaction Metrics
| Metric | Description | Example | Available At |
|---|---|---|---|
| Productivity | Captures the developer's subjective sense of their own effectiveness. Discrepancies between high output metrics and low productivity sentiment often reveal hidden friction or burnout. This voice-of-the-developer data is a leading indicator of retention risk. | 4.1 / 5 | Company, Department, Project |
| Tooling | Rates developer satisfaction with their development environment and toolstack. Frustration with tools is a common, solvable cause of productivity loss. Investing in areas with low scores directly improves the daily lived experience of the engineering team. | 3.8 / 5 | Company, Department, Project |
| Team Dynamics | Reflects the perceived quality of collaboration, mentorship, and communication within the team. Strong dynamics foster psychological safety and knowledge sharing. Low scores here can predict future delivery issues due to misalignment or interpersonal friction. | 4.0 / 5 | Company, Department, Project |
| Overall | Provides a holistic pulse check on developer happiness and engagement. It aggregates various satisfaction dimensions into a single health indicator. Tracking this trend over time helps validate whether process and culture changes are having a positive impact. | 4.3 / 5 | Company, Department, Project |
Task Acitivity Metrics
| Metric | Description | Example | Available At |
|---|---|---|---|
| Active Now | Shows the volume of work currently in progress across the team to help identify WIP overload. Limiting active tasks is a core principle of Flow and Kanban methodologies to improve throughput. | 8 tasks | Company, Department, Project |
| Sent to Review | Measures the flow of tasks moving from development to the review stage. A steady stream here indicates a healthy development cadence. Blockages at this stage suggest development is happening, but finishing is difficult. | 30 tasks | Company, Department, Project |
| Finished | Counts the number of tasks fully completed and delivered. This is the ultimate measure of throughput and value delivery. Consistent completion rates are the hallmark of a predictable, high-performing team. | 112 tasks | Company, Department, Project |
| In Review Now | Quantifies the backlog of work currently sitting in the review phase. A large accumulation here points to a review bottleneck that needs immediate attention. Clearing this queue unleashes value that has already been created but not shipped. | 10 tasks | Company, Department, Project |
| Recent | Tracks tasks that have seen activity in the recent window. This helps differentiate between stale backlog items and work that is actually moving. It provides a realistic view of the active working set. | 18 tasks | Company, Department, Project |
| With Commits | Identifies tasks that have associated code changes. This verifies that tracked work is resulting in tangible engineering output. It helps link project management tickets to actual development activity. | 35 tasks | Company, Department, Project |
| Total | Provides the denominator for many activity metrics by counting the total task universe in scope. Understanding the total volume context is necessary for interpreting percentages and rates. It helps scale metrics relative to the size of the workload. | 200 tasks | Company, Department, Project |
| With AI | Measures the penetration of AI tools at the task level. It shows what percentage of delivered value utilized AI assistance. This connects tool adoption directly to business outcomes and task completion. | 35% | Company, Department, Project |
| With Collaboration | Tracks the portion of tasks that involved synchronous collaboration. This highlights complex work items where pair programming or swarming was utilized. It validates that collaboration is happening on the work that likely needs it most. | 22% | Company, Department, Project |
Task Efficiency Metrics
| Metric | Description | Example | Available At |
|---|---|---|---|
| Effective Coding Speed | Measures the net velocity of code production, accounting for the time spent in the IDE. It focuses on the speed of generating value rather than just raw keystrokes. This helps identify high-performing workflows or conversely, environments where friction slows down output. | Net Velocity = 50 tasks / 200 IDE hours = 0.25 tasks per IDE hour | Company, Department, Project |
| In-Task Code Churn | Quantifies the ratio of edits and rewrites to the final delivered code size. High churn suggests requirements were unclear or the solution was discovered through trial and error. Lowering churn through better planning significantly reduces wasted engineering effort. | 4.5x | Company, Department, Project |
| Time to Review | Tracks the duration from starting a task to submitting it for peer review. This phase represents the core coding cycle. Optimizing this time often involves removing local environment blockers or clarifying technical specifications. | 1.2 days | Company, Department, Project |
| Time to Task Start | Measures the latency between a task being assigned or activated and work actually beginning. Long delays here suggest context switching costs or hesitation due to ambiguity. Reducing this gap helps maintain momentum and flow. | 1.1 days | Company, Department, Project |
| Coding Efficiency | A composite metric combining coding speed and typing efficiency. It penalizes 'waste' (excessive deletions and rewrites) while rewarding consistent value generation. This provides a balanced view of technical proficiency and workflow smoothness. | 82% | Company, Department, Project |
Task Estimation Metrics
| Metric | Description | Example | Available At |
|---|---|---|---|
| Over Estimate | Identifies tasks that significantly exceeded their estimated time range. Frequent overruns disrupt sprint planning and predictability. Analyzing these tasks often reveals hidden complexity or a tendency to be optimistic in planning. | 15% | Company, Department, Project |
| With Estimate | Counts the volume of tasks that have an assigned effort estimate. High coverage here is a prerequisite for reliable planning and velocity tracking. It ensures that the team is thinking about complexity before starting work. | 93% | Company, Department, Project |
| Without Estimate | Counts the volume of tasks that have an assigned effort estimate. High coverage here is a prerequisite for reliable planning and velocity tracking. It ensures that the team is thinking about complexity before starting work. | 7% | Company, Department, Project |
| Accuracy | Measures the precision of the team's forecasting by comparing actuals to estimates. High accuracy builds trust with stakeholders and allows for confident release planning. Improving this requires a feedback loop where teams review past variance. | 92% | Company, Department, Project |
Work Distribution Metrics
| Metric | Description | Example | Available At |
|---|---|---|---|
| Active Engineers | Counts the number of engineers actively contributing code during the period. This helps gauge the actual capacity available versus the total headcount. Gaps here may indicate team members pulled into non-engineering tasks or onboarding. | 12 engineers | Company, Department, Project |
| Engineer Days | Aggregates the total days of active engineering effort applied. This provides a volume metric for resource investment. It helps validate if the team is spending enough time on hands-on development versus administrative overhead. | 25 days | Company, Department, Project |
| Idle Engineers | Identifies engineers with little to no detected coding activity. While this may be valid for leads or managers, unexpected idleness signals blockers or process issues. Early detection allows for support to be offered to re-engage these team members. | 3 engineers | Company, Department, Project |
| Total Engineers | Provides the total headcount context for distribution metrics. It ensures that activity and efficiency metrics are normalized against the team size. This is the baseline for understanding capacity utilization. | 20 engineers | Company, Department |
| Engagement | Measures how consistently engineers are meeting daily active coding targets. It reflects the organization's ability to protect 'maker time' for developers. High engagement means the environment successfully supports sustained, hands-on engineering work. | 78% | Company, Department, Project |
| Productivity | A composite score combining developer engagement (time spent working) with task efficiency (quality of work). It answers the question: Are we working enough, and is that work effective? This holistic view prevents optimizing for busywork over value creation. | 88% | Company, Department, Project |
| Underutilized Rate | Quantifies the available capacity that is not being applied to active development. This represents the 'opportunity cost' of lost engineering time. Reducing this rate often involves minimizing meeting loads or administrative burdens. | 3 engineers | Company, Department, Project |
| Workload Balance | Analyzes the distribution of coding effort across the team to detect burnout or underutilization. A balanced workload ensures that no single individual is a bottleneck or carrying the team. Equitable distribution is key to long-term sustainability and retention. | 43% | Company, Department, Project |