Using the Reports Dashboard
The Reports Dashboard in CodeTogether offers a comprehensive view of engineering performance, enabling teams to allocate resources effectively, identify inefficiencies, and focus efforts where they matter most. This report provides an at-a-glance visualization of engineering productivity and activity across your Company, Departments, and Projects, giving you valuable insights into team performance and progress.
Accessing the Reports Dashboard
Viewing Reports requires specific role-based permissions.
To access the Reports Dashboard:
- Open the CodeTogether Portal.
- Select Reports from the sidebar to open the Reports Dashboard page.
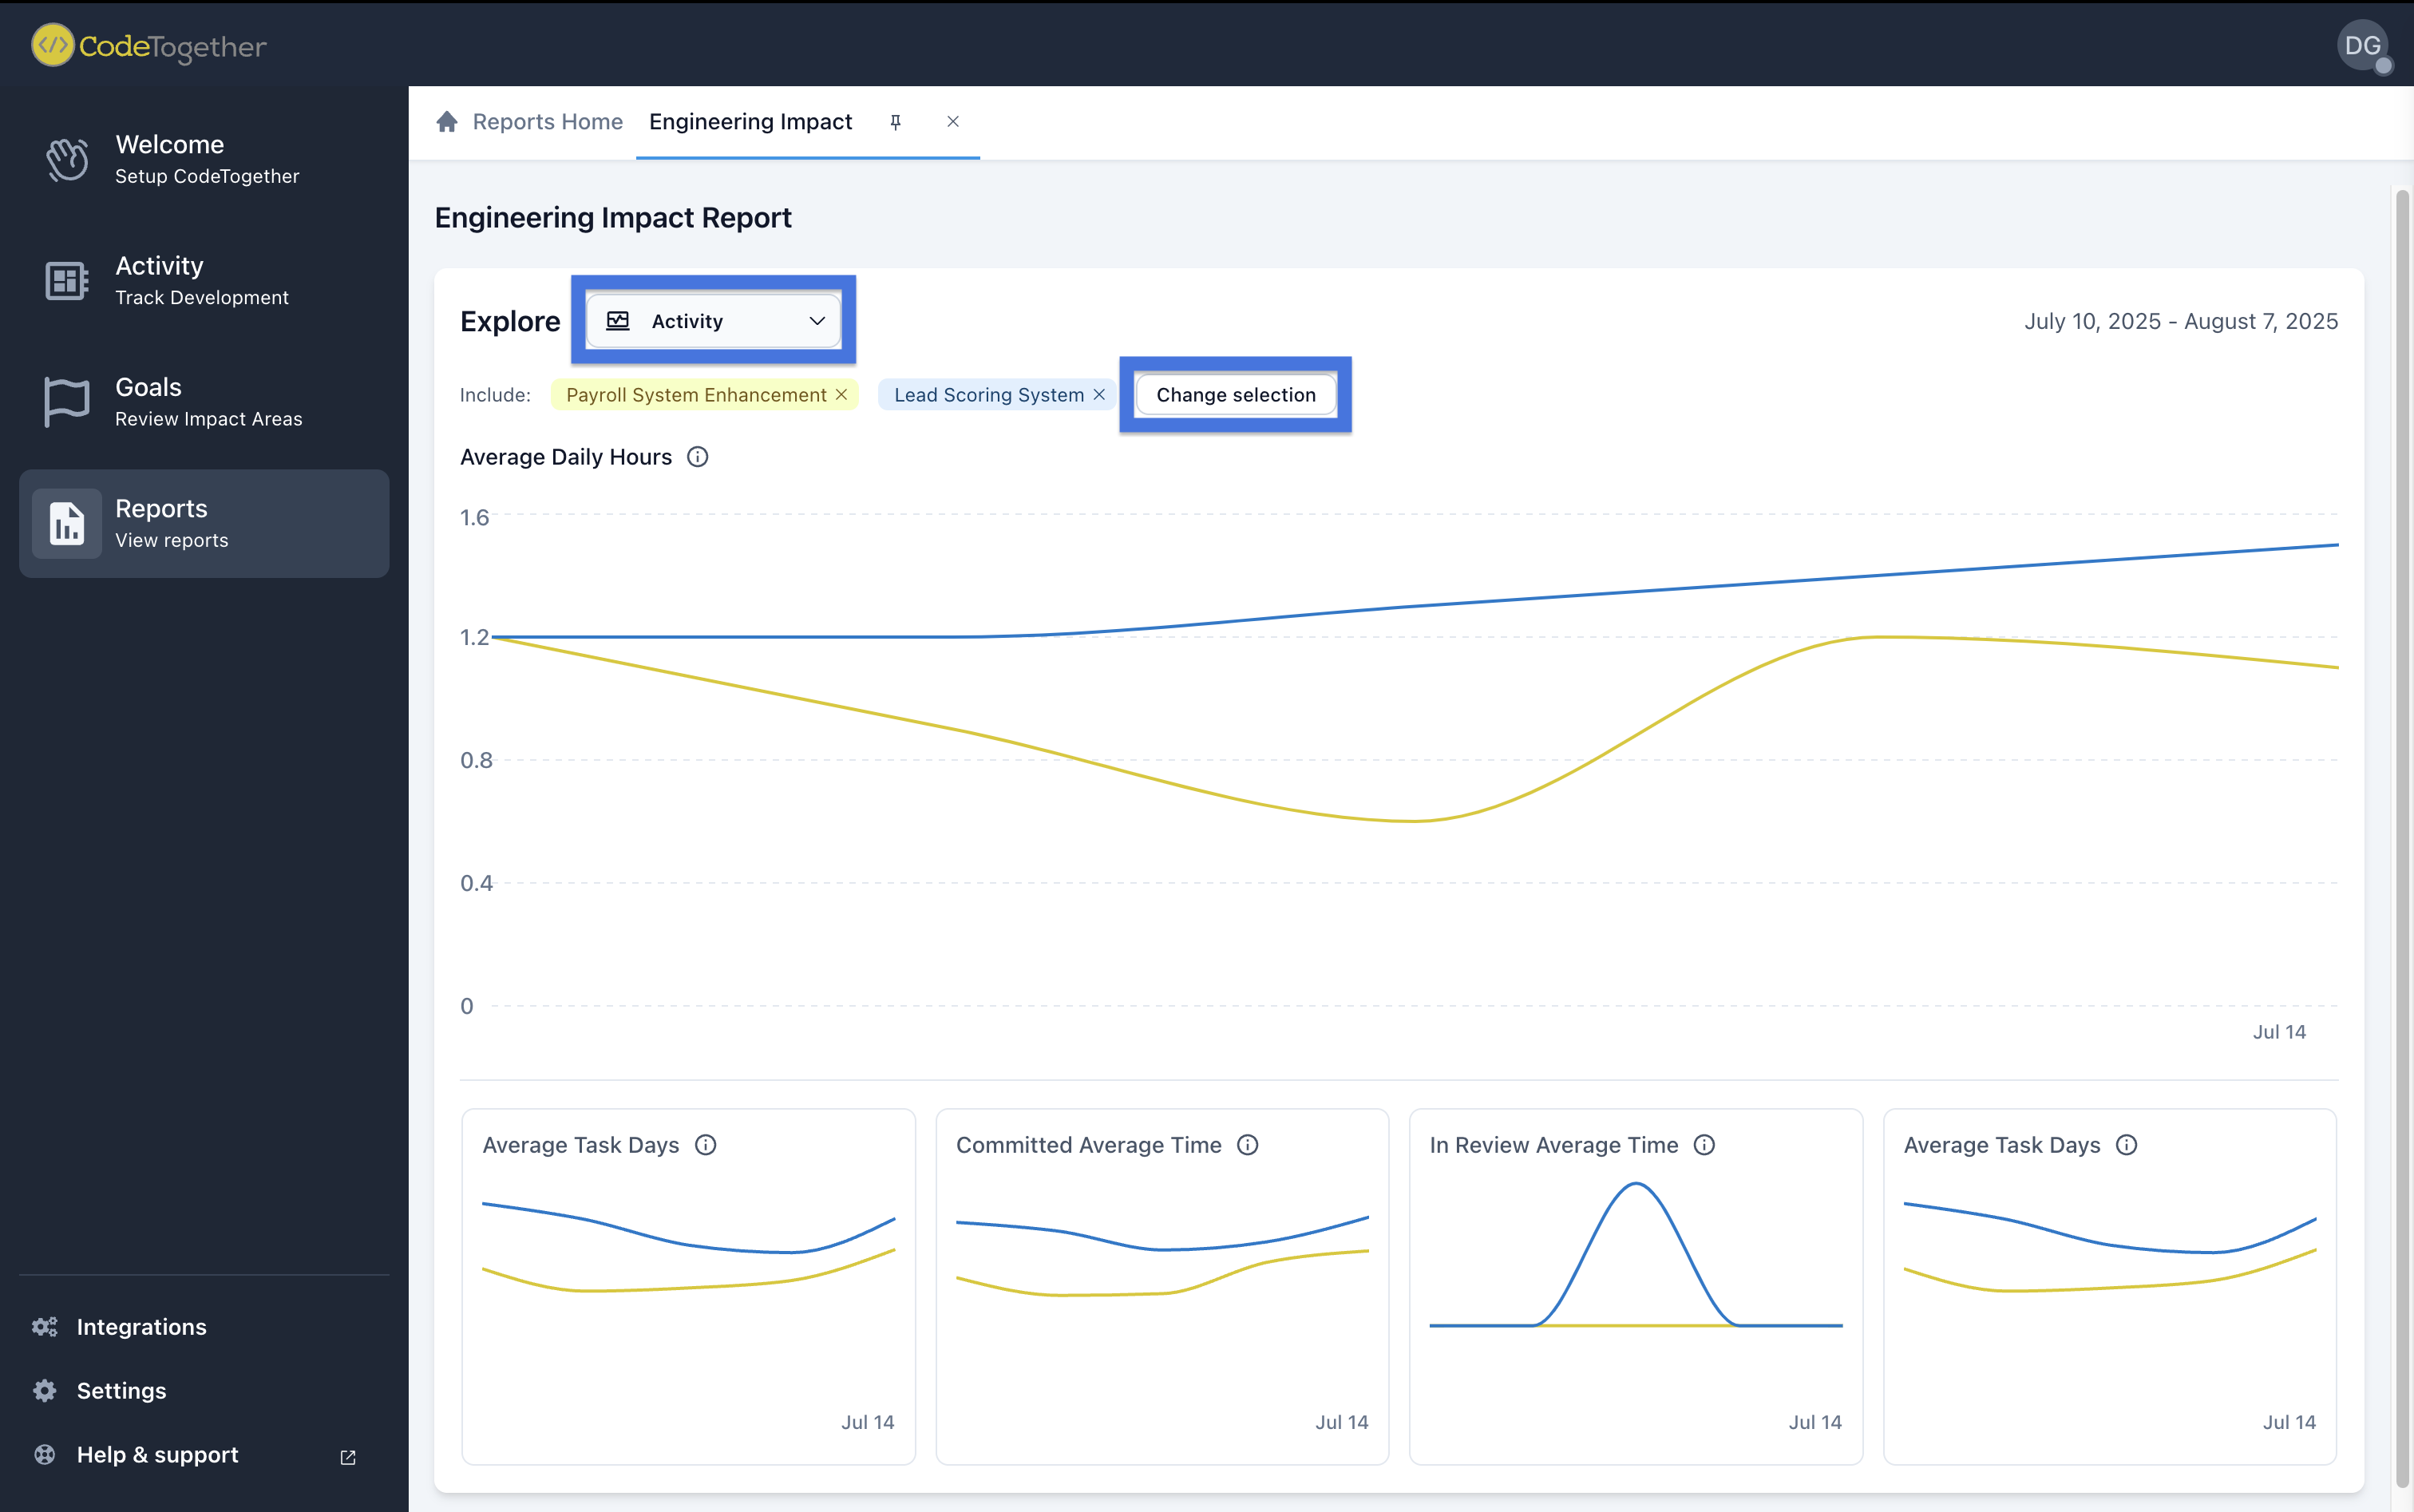
Engineering Impact Report
The Engineering Impact page gives teams a clear view of how engineering work contributes to outcomes across projects. It helps you understand not just what is being delivered, but also how effectively teams are working together over time.
What You’ll See
- Explore by Metrics: Choose key dimensions like Productivity and Activity.
- Comparisons: Compare the impact of different containers to see where productivity trends are rising, stabilizing, or needing attention.
- Time Trends: Track changes week-over-week to spot patterns, such as where work velocity accelerates, or where engagement dips.
Key Features of the Engineering Impact Report
- Access through the Reports tab in the left navigation (below Goals).
- View metrics from the last 28 days, excluding the current day.
- Default view loads with no area selected and Productivity as the default metric.
- Select and compare up to five areas at a time (Company, Department, and/or Project).
- Your selections are retained between Explore types, unless the report is closed.
- Interactive graphs with hover details for clearer comparisons.