Project Manager: Top Use Cases
This section helps Project Managers keep projects on track, align team efforts, and ensure deliverables are completed as expected. It highlights key tools that provide visibility into progress, surface blockers, and support continuous improvement throughout the development cycle.
Viewing Project Specific Insights
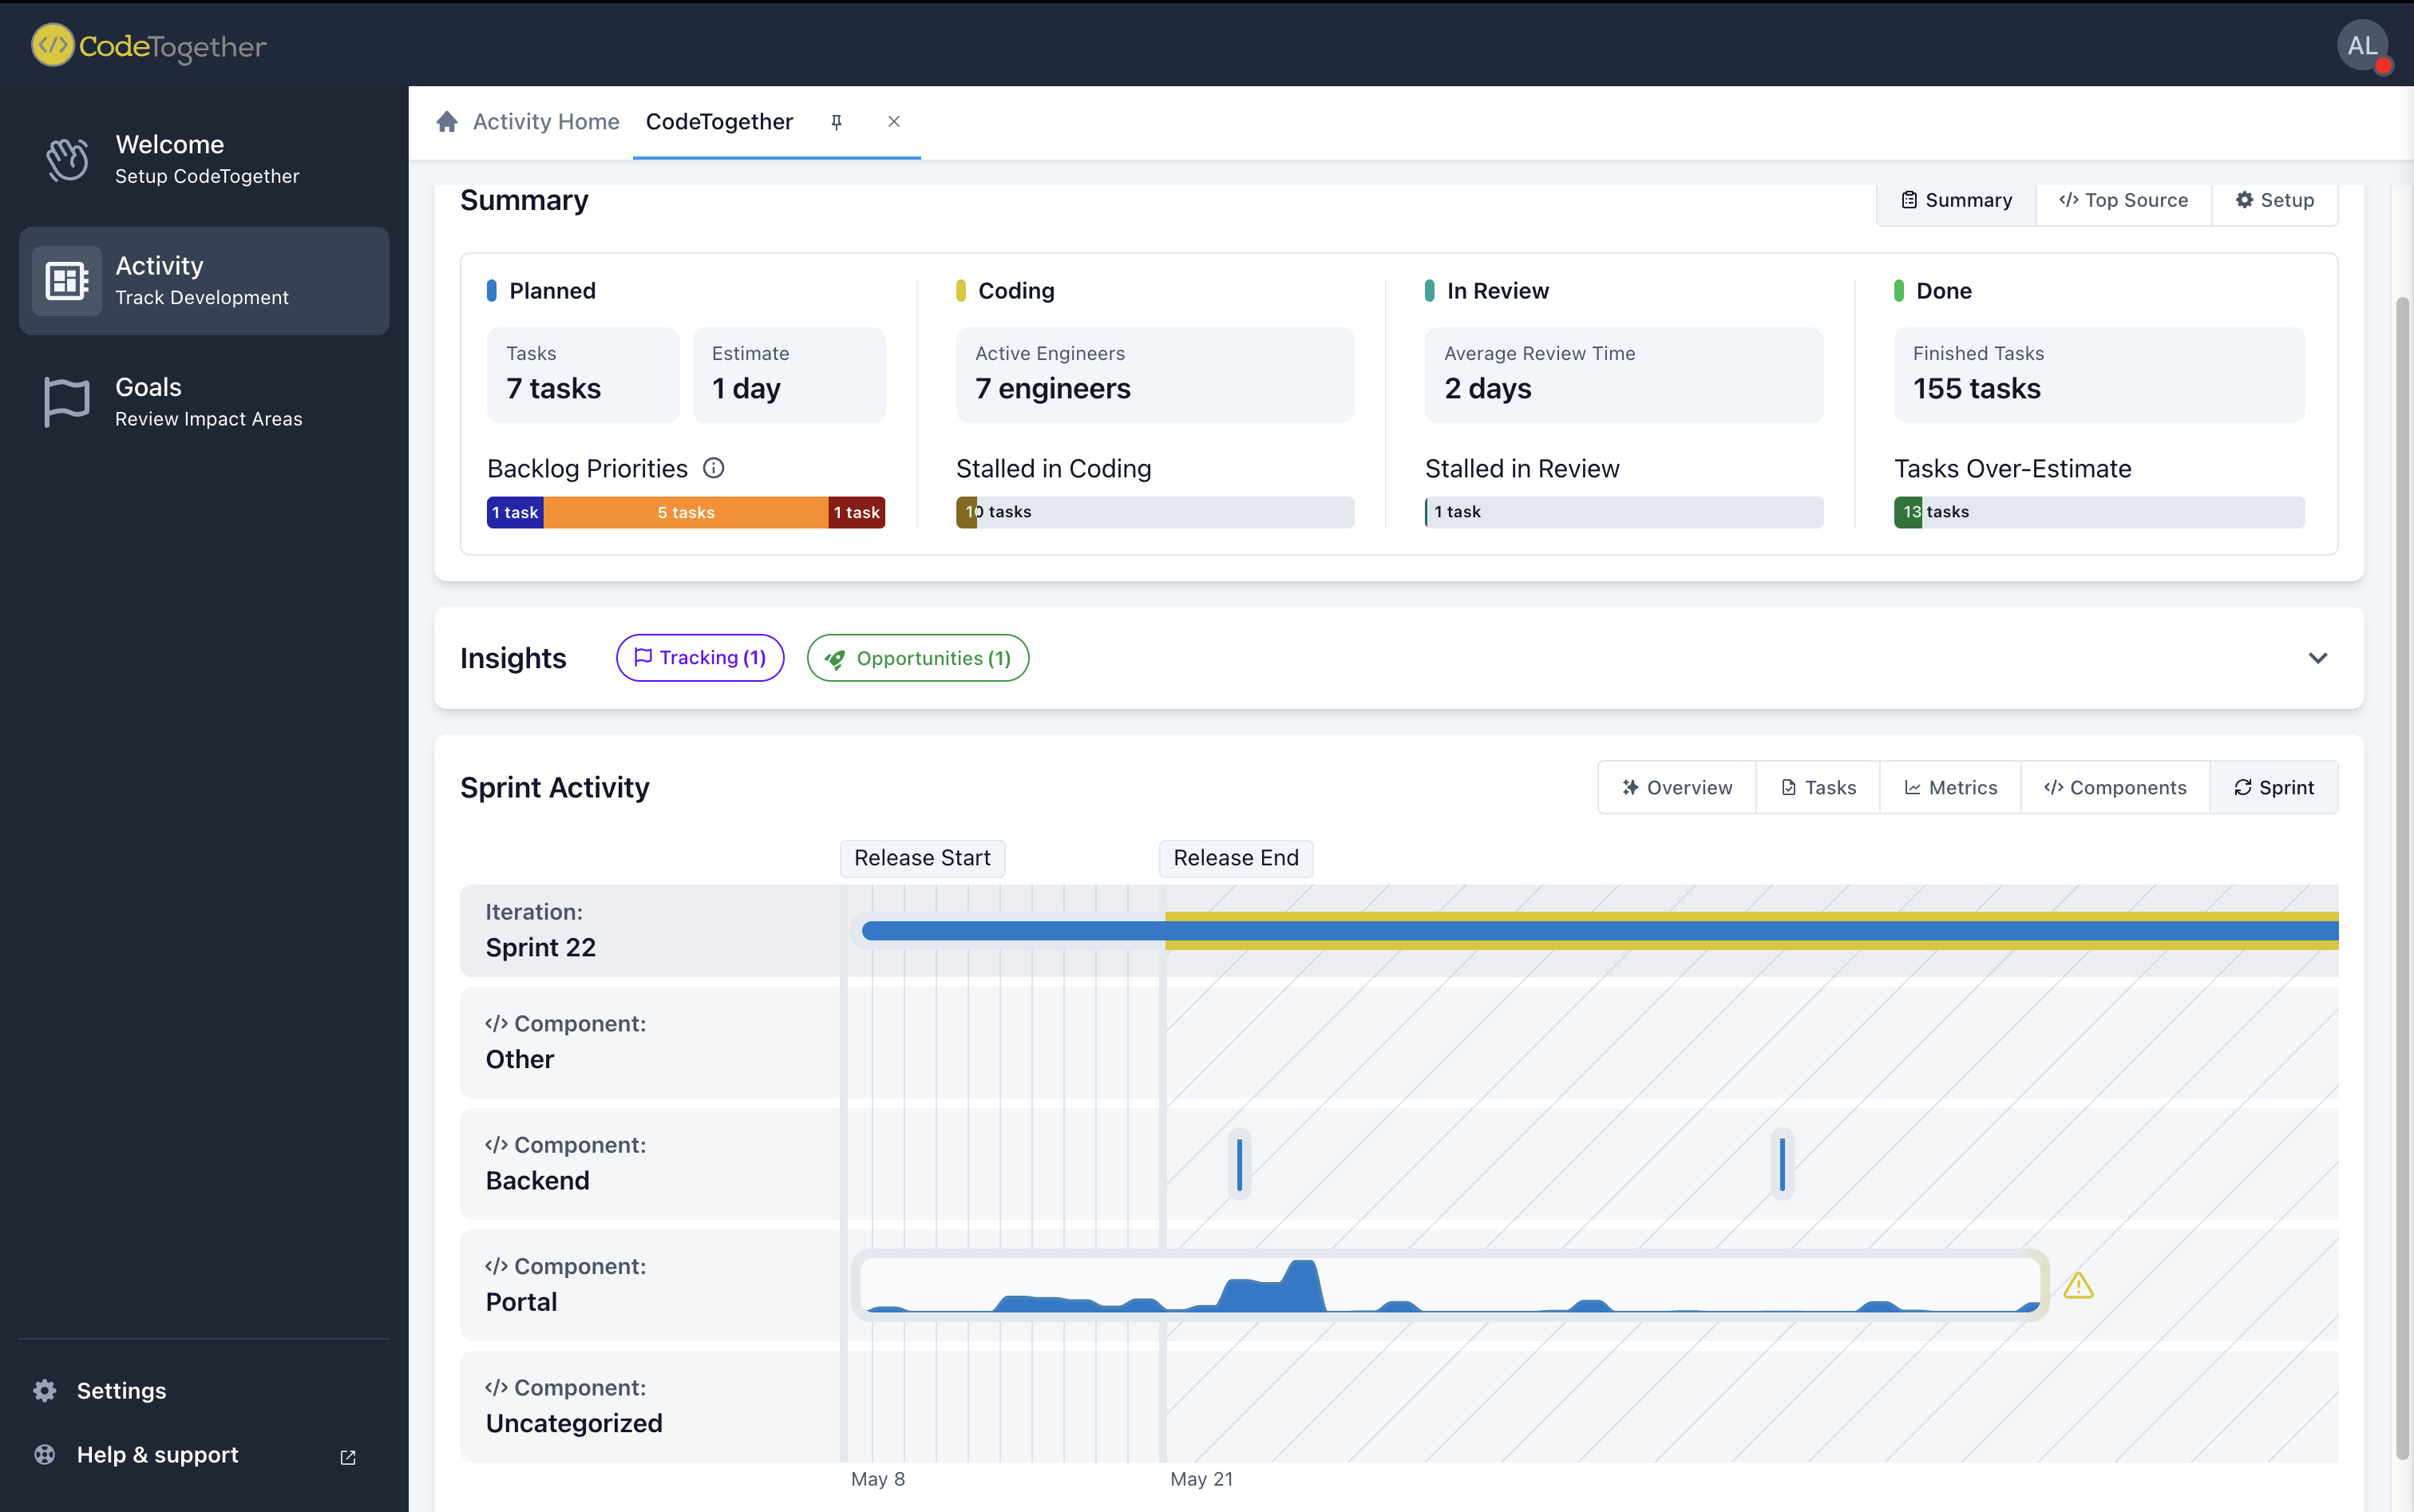
You can view Goals and Watched Metrics on a per project basis by going to the Activity section in the left hand panel, selecting a specific project, and navigating to the Insights tab.
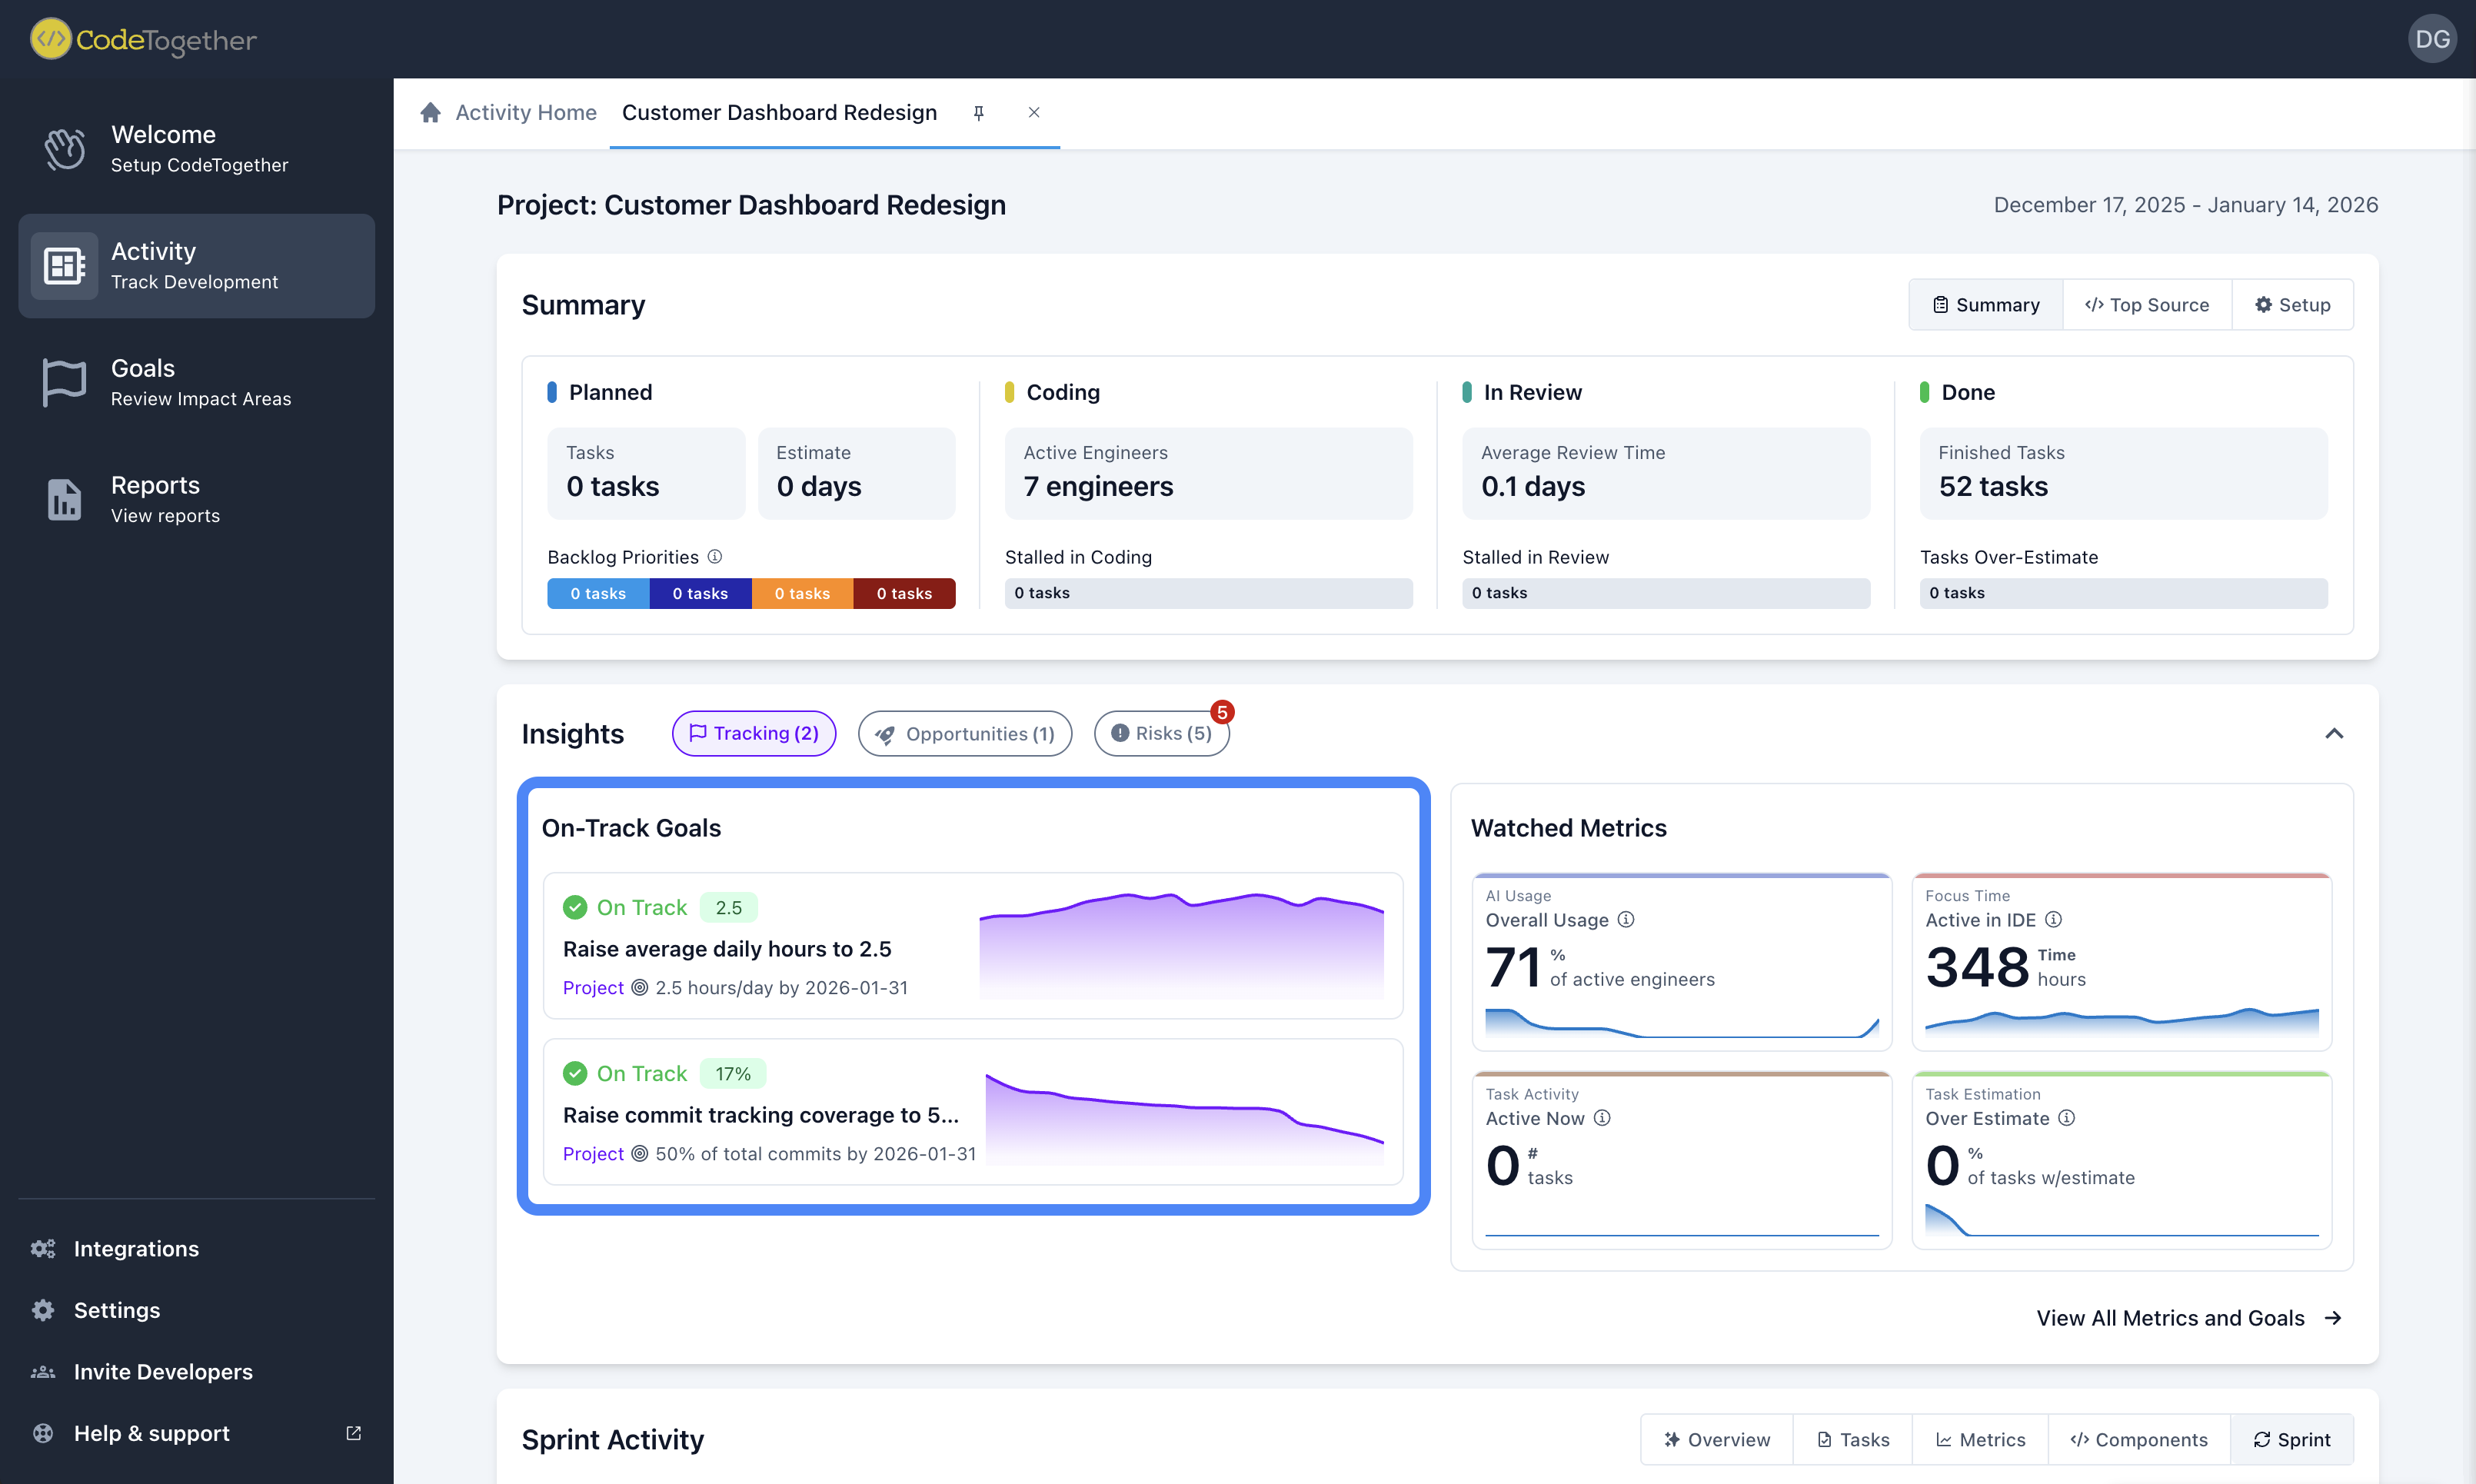
The Sprint section is also available within the same project view, located just below Insights.
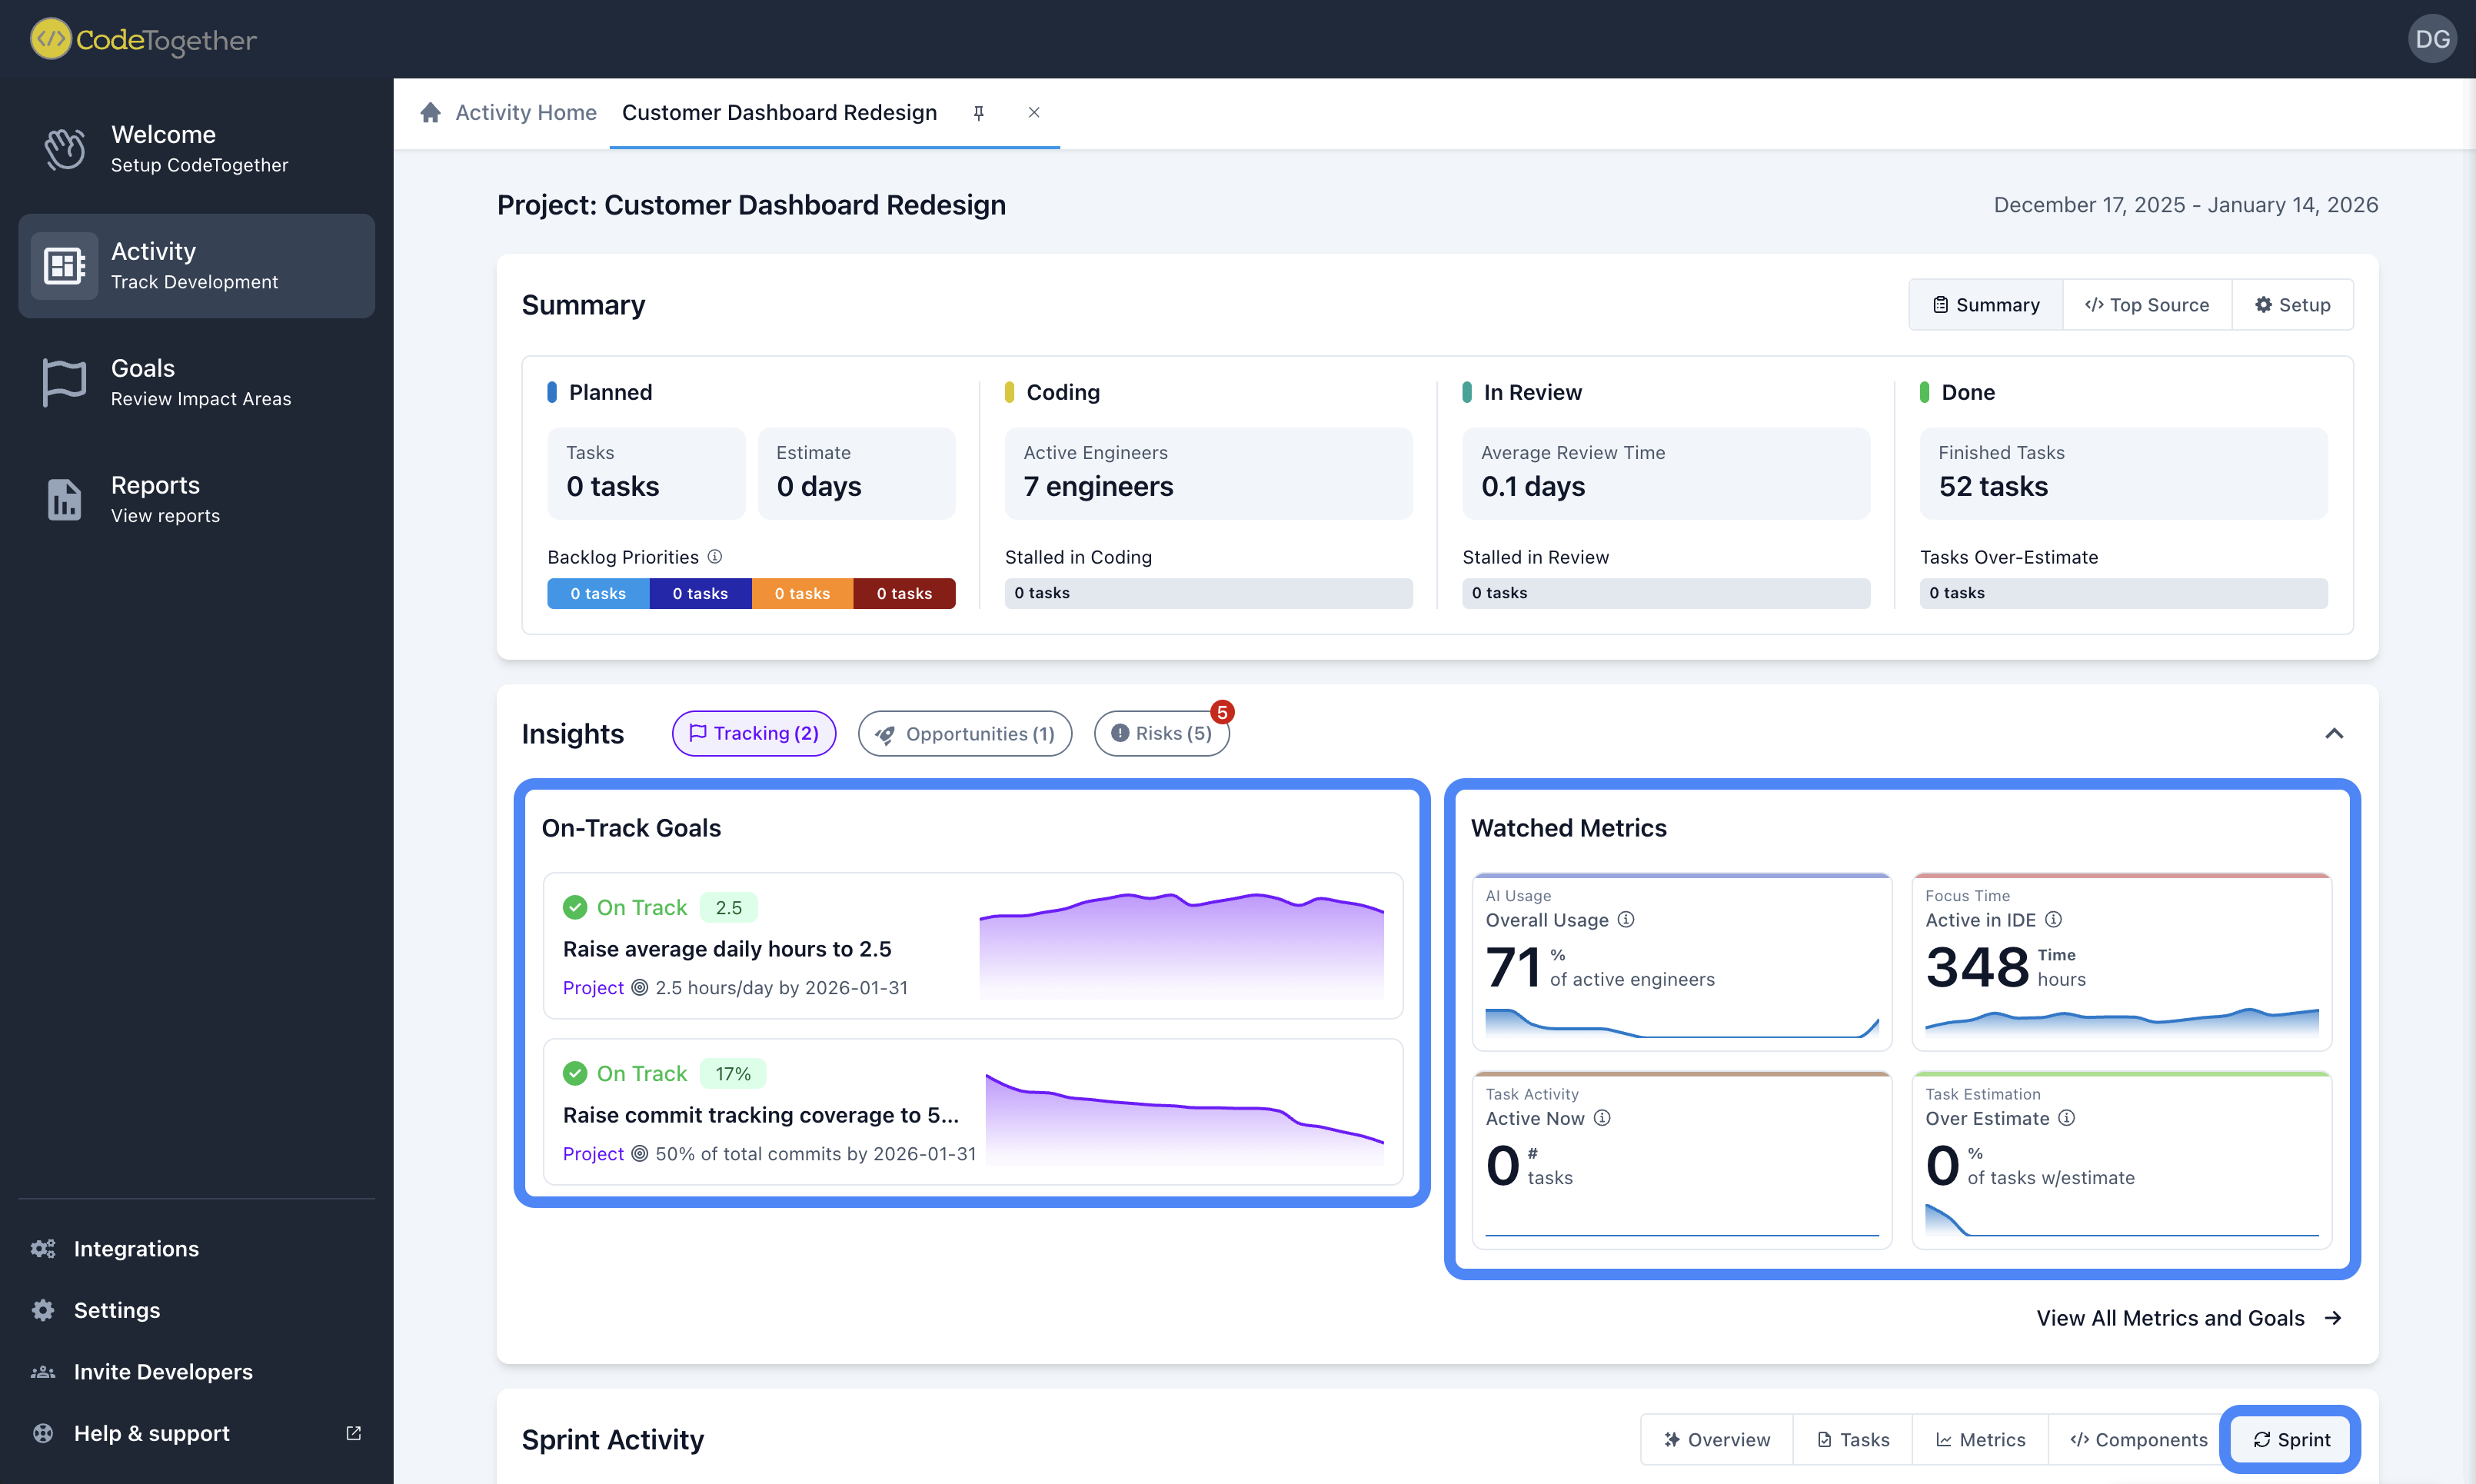
Goals
The Goals section allows Project Managers to define and track success metrics for their projects. These metrics act as clear targets for the team and help ensure alignment across stakeholders. Having visible, measurable goals supports better focus, prioritization, and accountability.
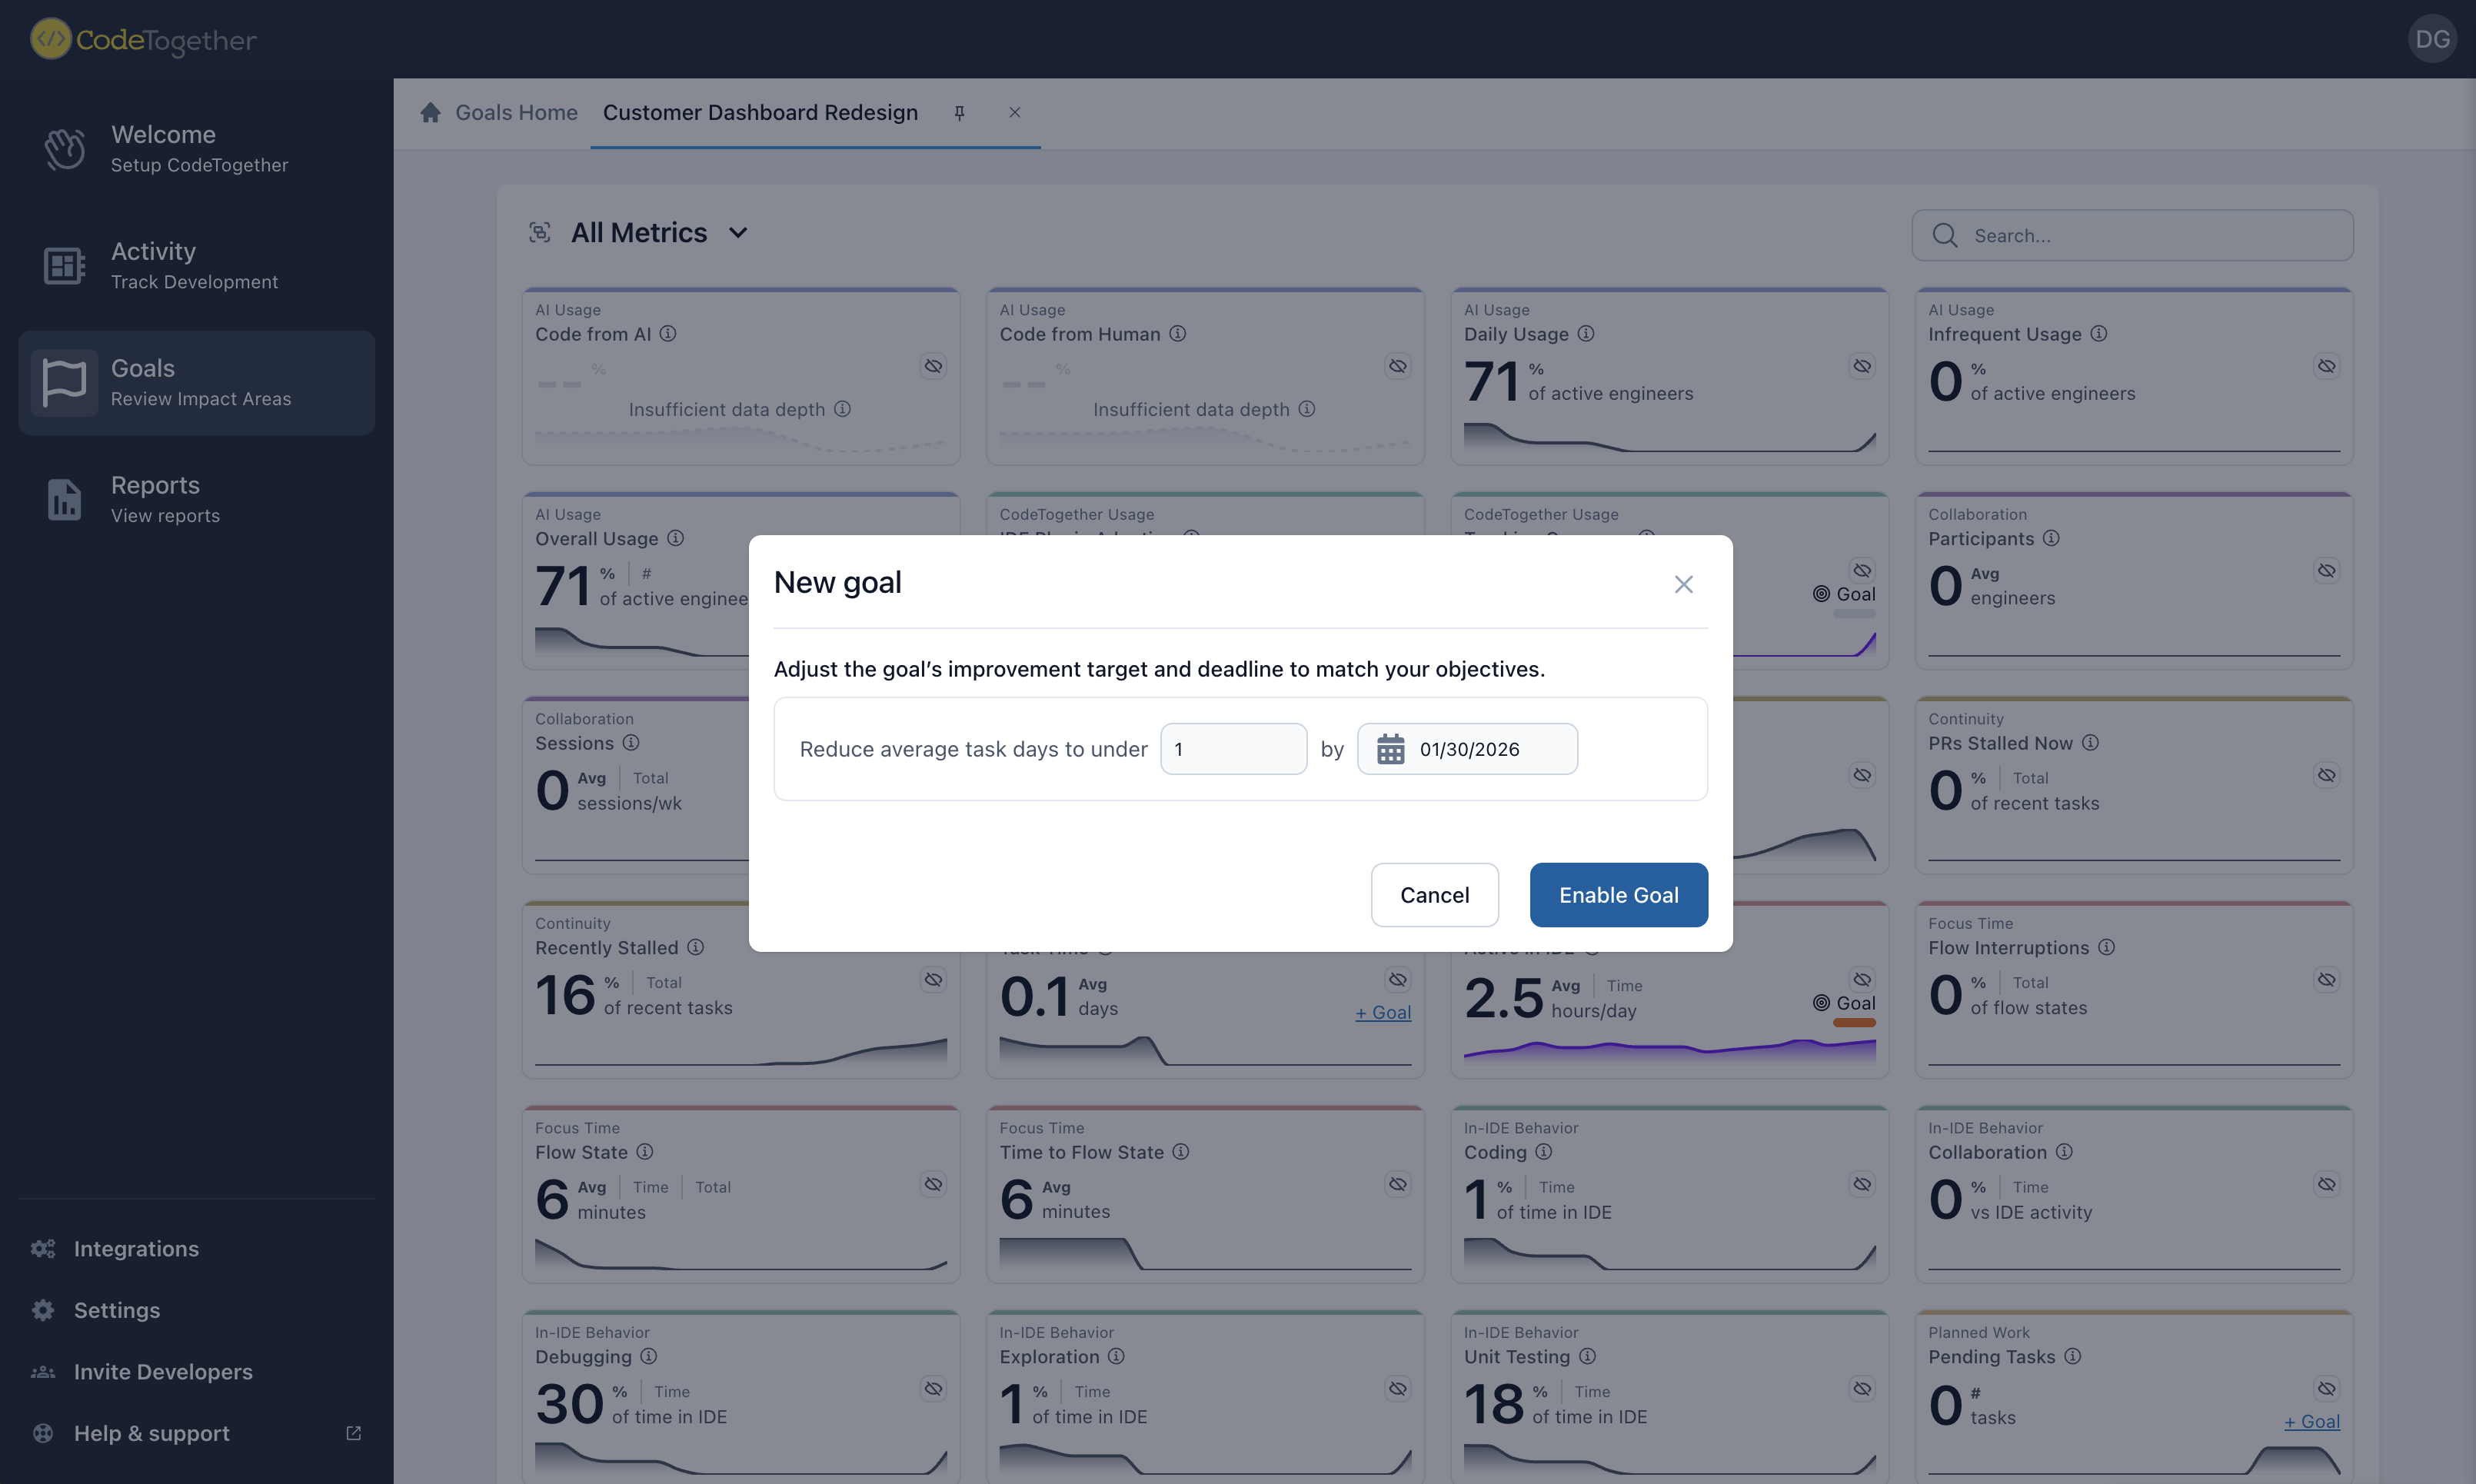
How to configure goals?
Go to the Goals section in the left hand panel, then scroll down to the All Metrics section. Click on Setup Goal for the metric you want to configure, fill in the required details, and click Enable Goal. That’s it!
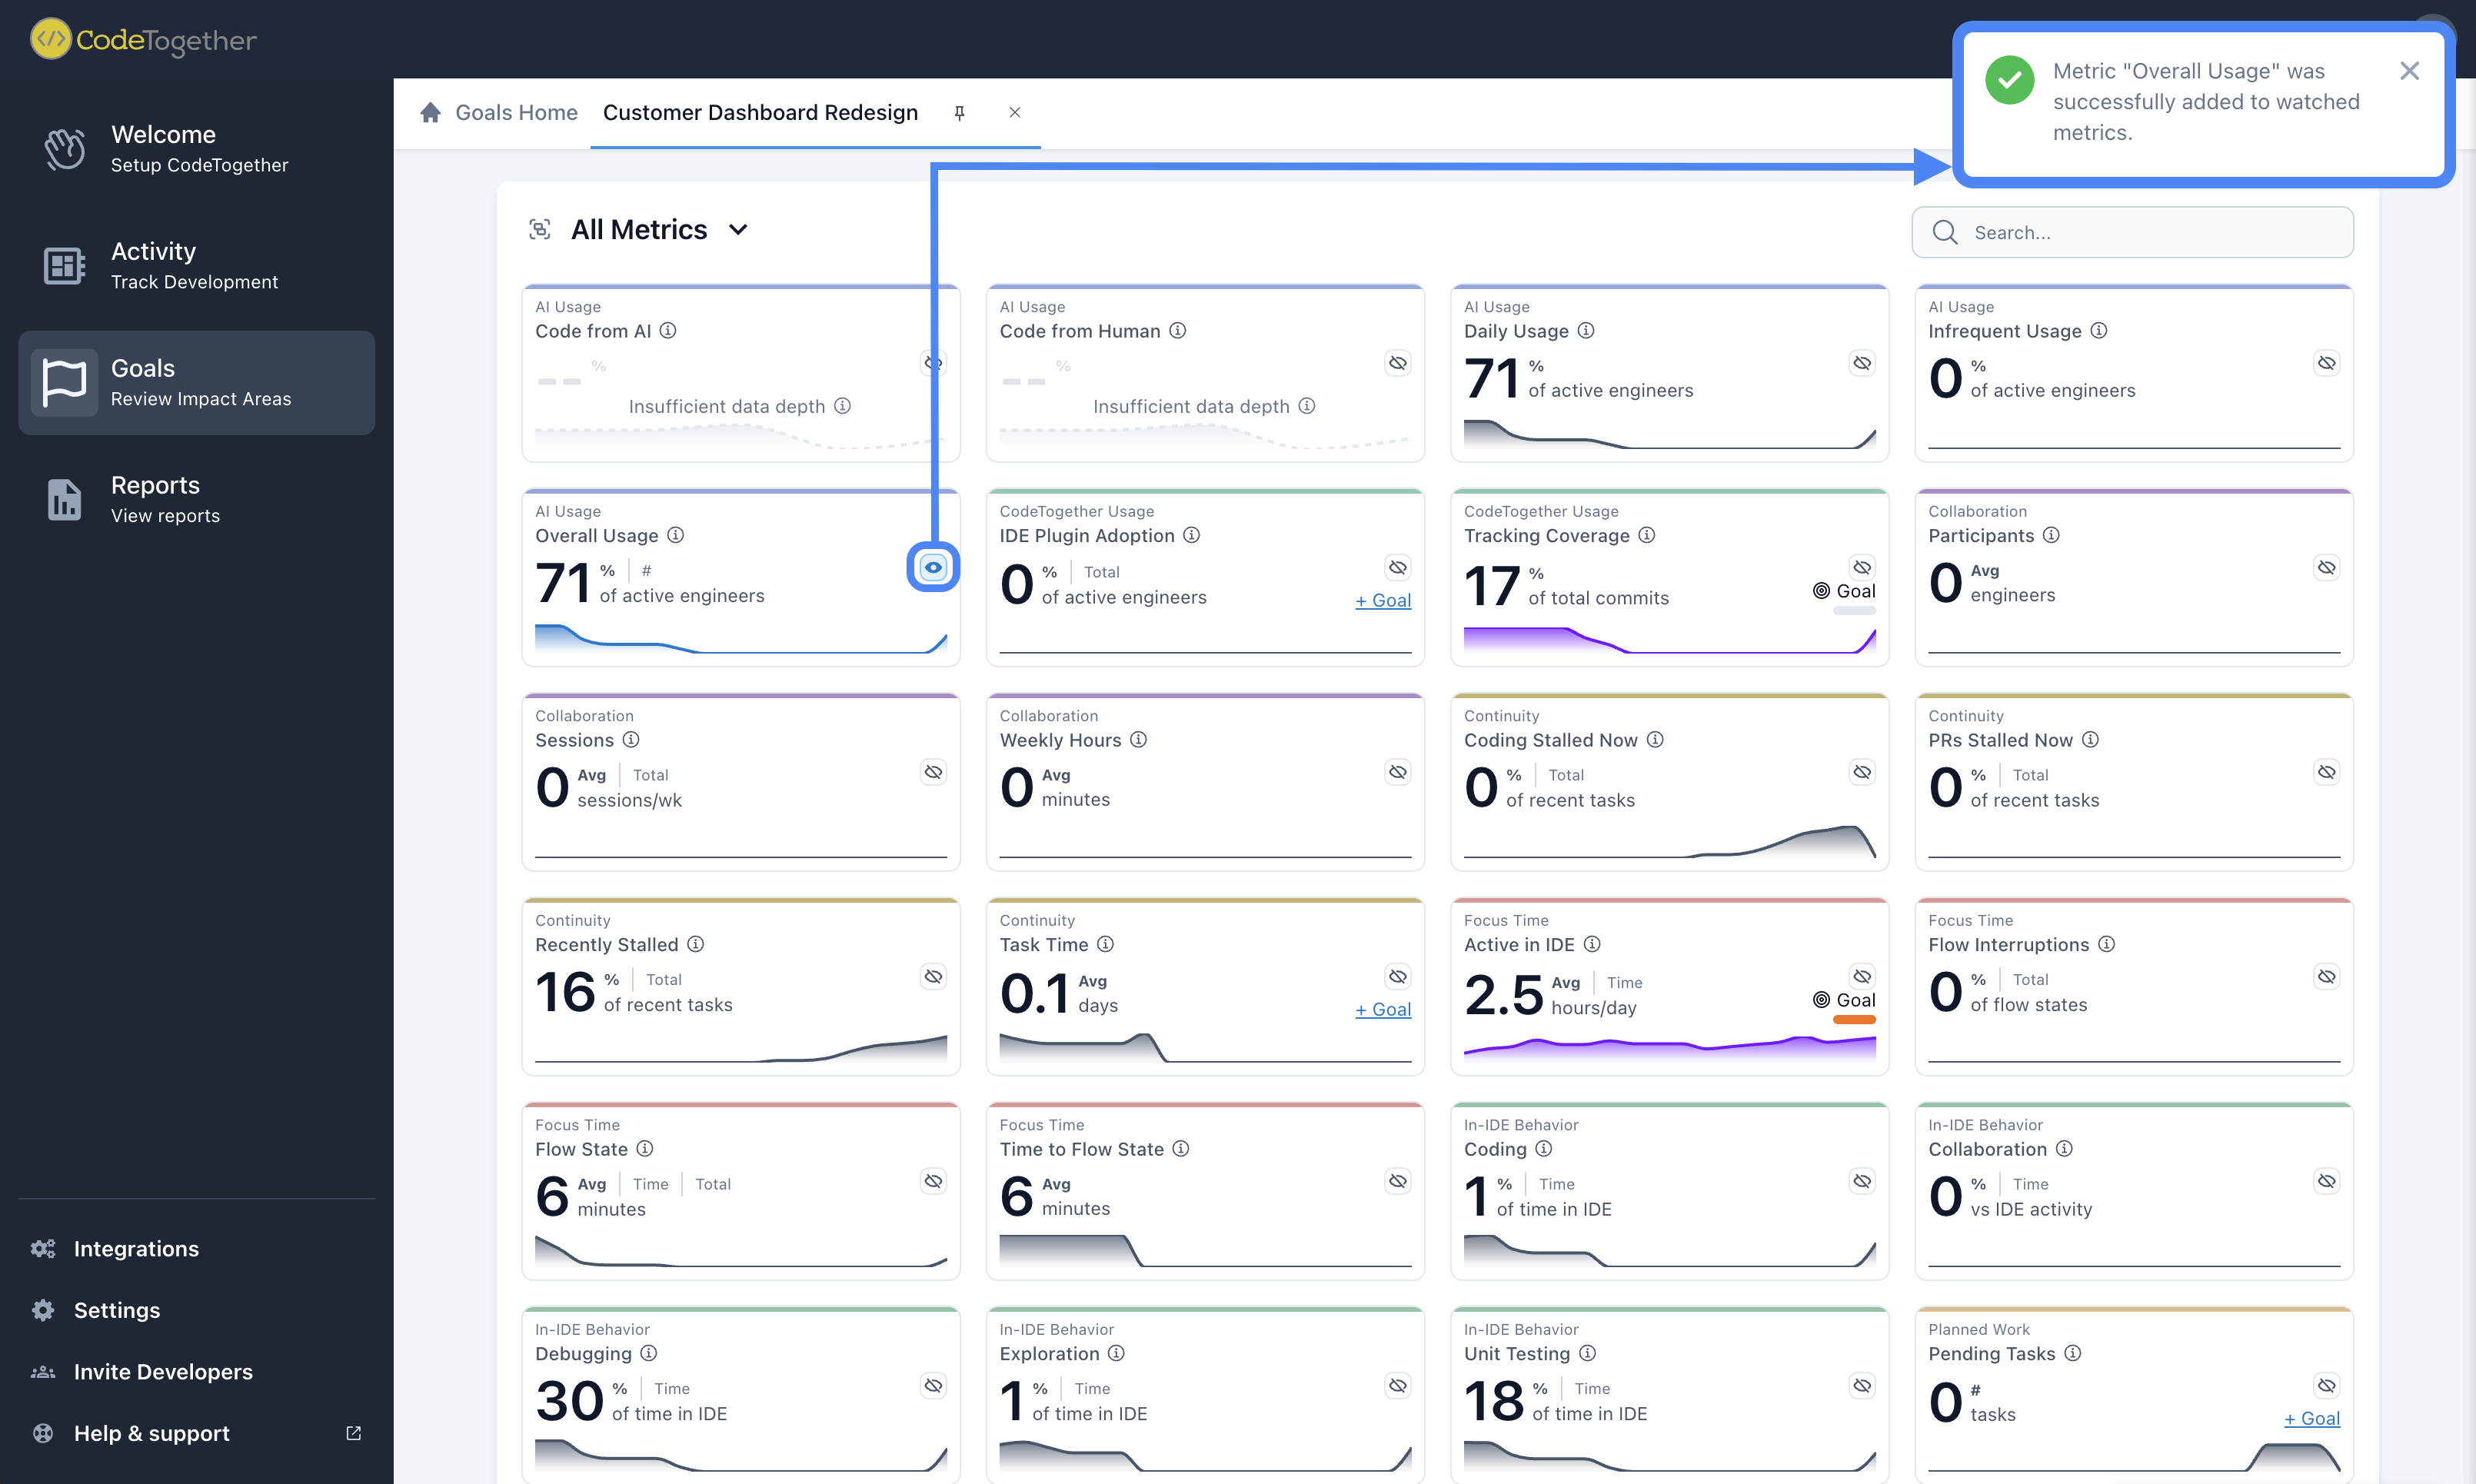
Watched Metrics
By marking key indicators as “watched” in the Insights section, Project Managers can keep the most relevant data front and center. This makes it easier to monitor areas that matter most and react quickly when issues arise.
Recommended metrics to watch include:
- Average Daily Hours – Understand how much time team members are spending across tracked activities.
- Productivity – Gauge how effectively time is being converted into deliverables.
- Estimation Accuracy – Compare planned vs. actual effort to improve future planning.
Tracking these metrics over time helps surface inefficiencies, improve workload management, and support more accurate forecasting.
How to add a watched metric?
To watch a metric on your project dashboard, go to the Goals section in the left hand panel section, then scroll to the All Metrics section. From there, anyone with access (including the Project Manager or Development Manager) can find the desired metric and click the eye icon to make it visible on the dashboard.
Sprint
The Sprint section gives an overview of how each sprint is progressing. It includes data like completed vs. committed work, velocity trends, and any carried over tasks. This view helps Project Managers evaluate execution, identify slippage, and refine planning for future sprints.
By analyzing sprint history, Project Managers can guide their teams toward more realistic commitments and improve overall delivery rhythm.
How to configure the Sprint section
To ensure accurate sprint data and unlock all metrics in this view, make sure the following setup is complete:
- Components – These categorize your issues (e.g. Integration, Front End, Back End). Go to your project’s Settings, find the Components section, and create the components that match your team’s workflow.
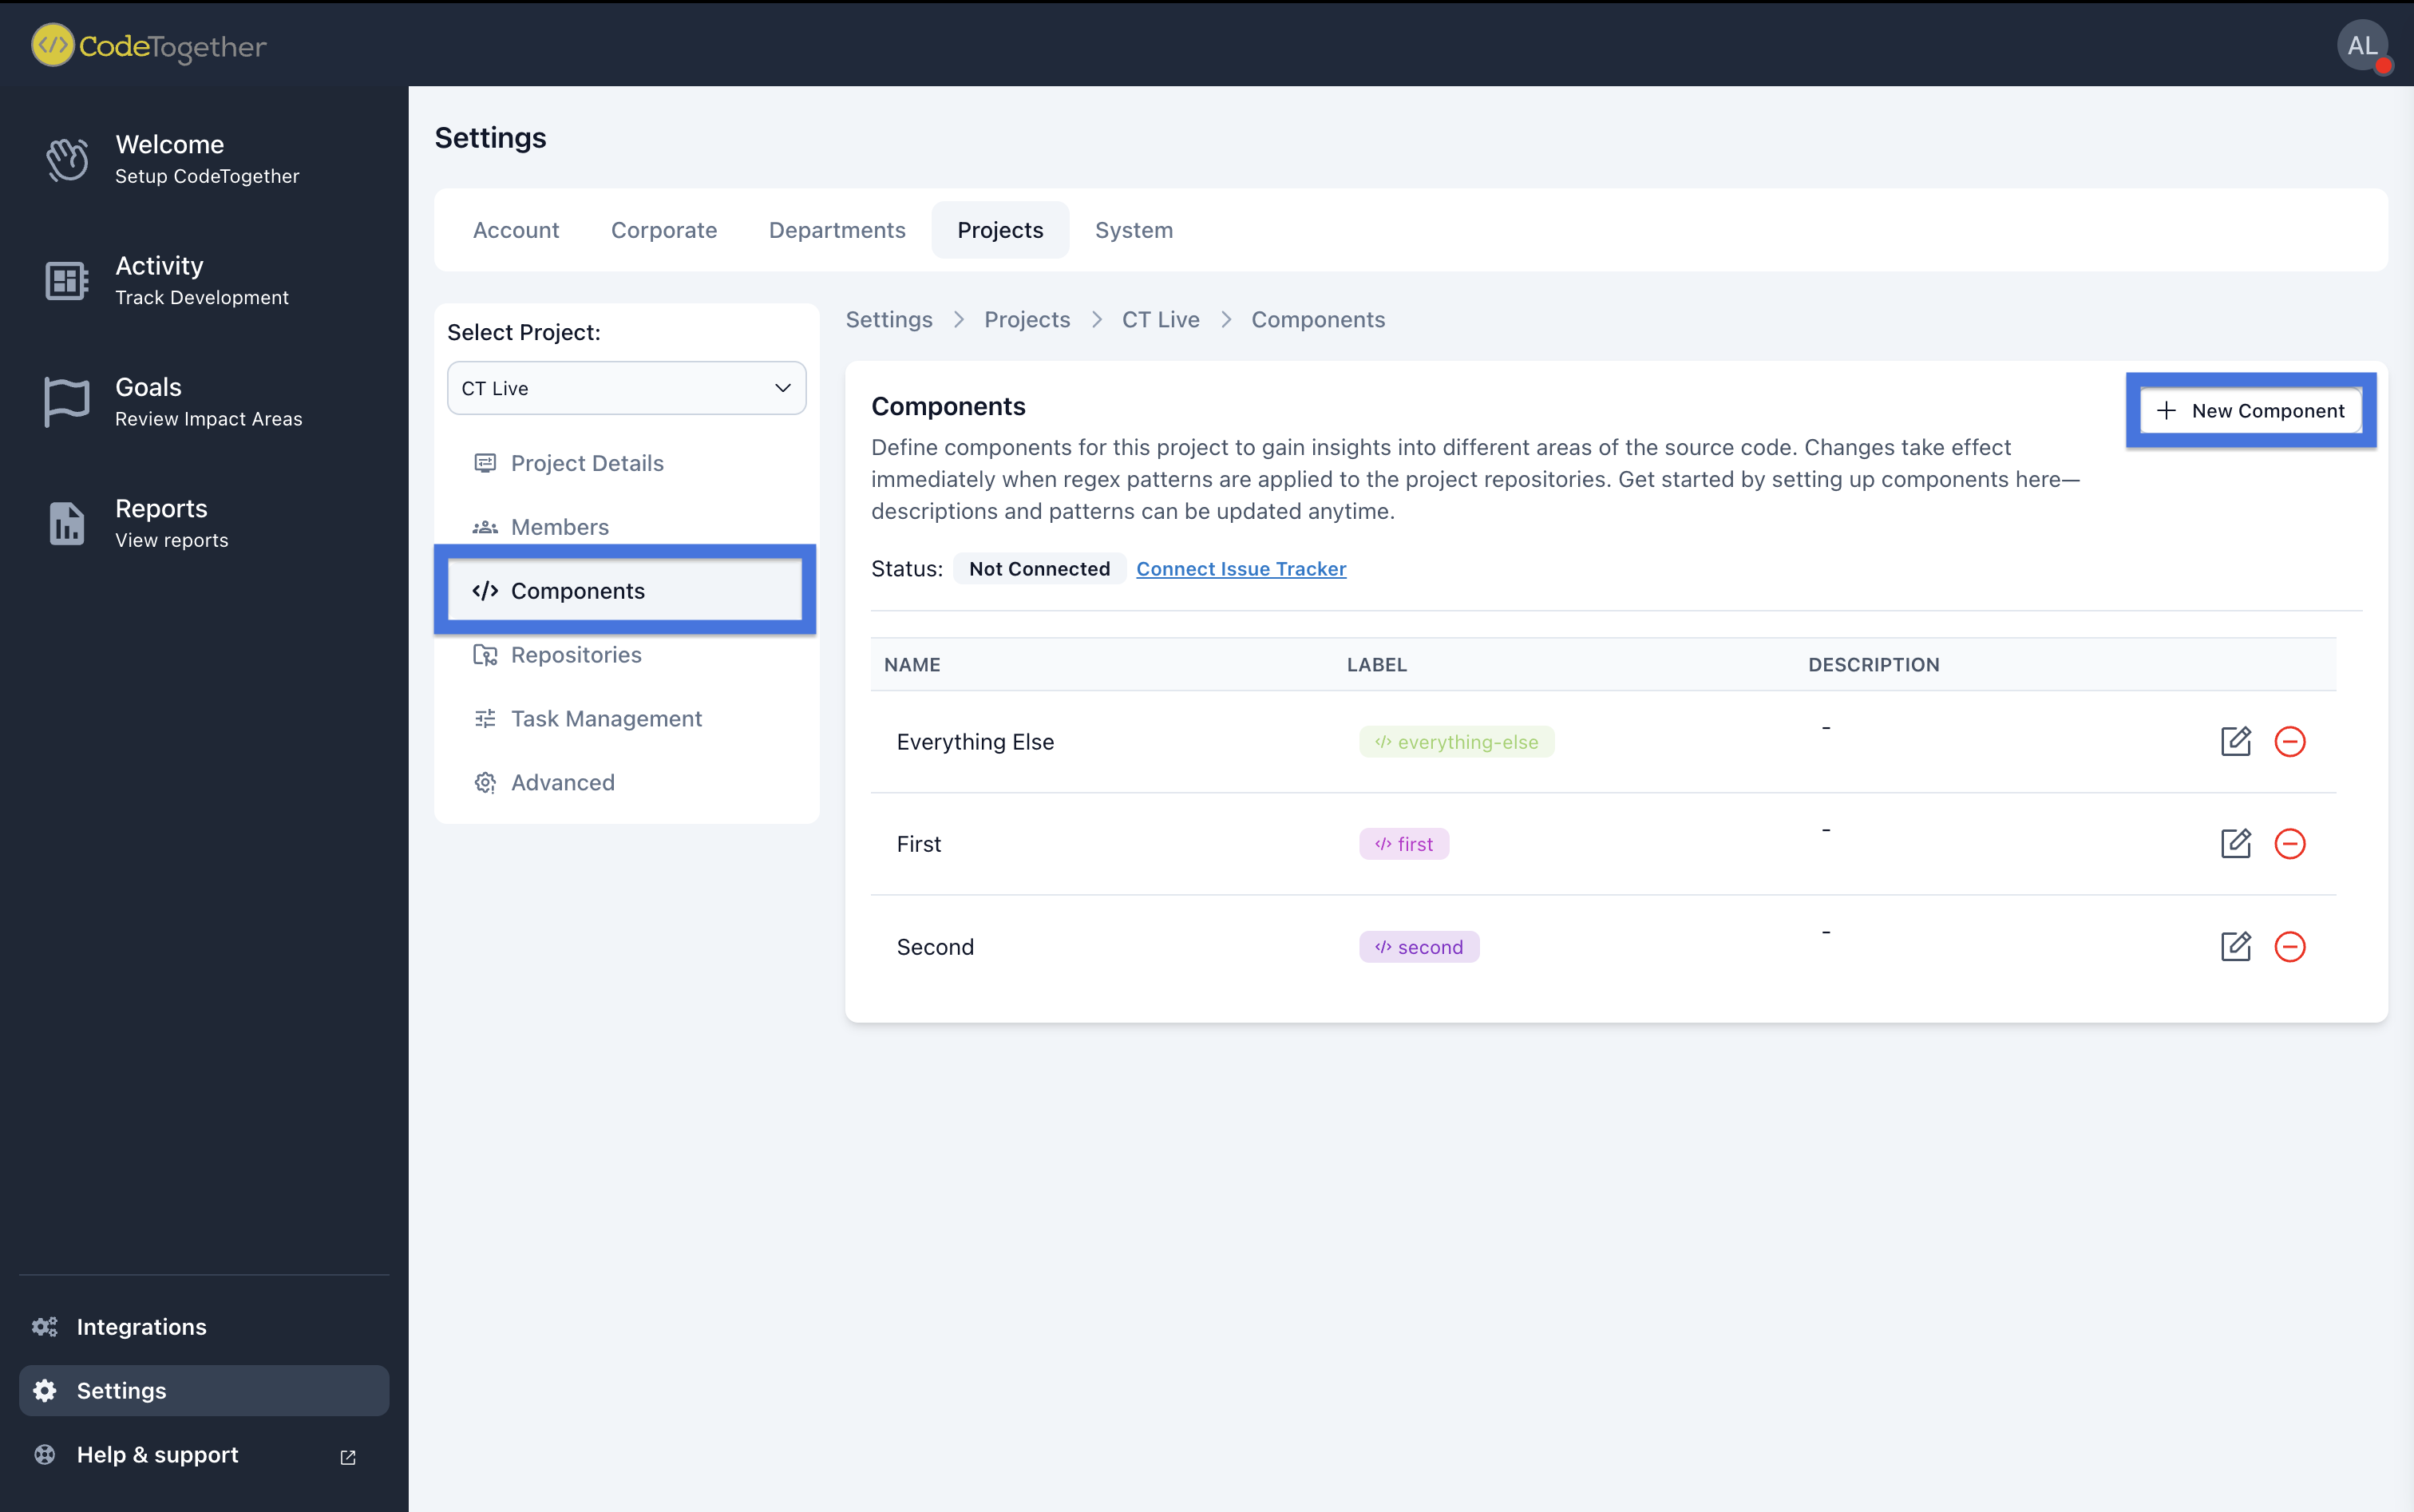
- Issue Tracker Integration – Go to your Project Settings and look for the option to Connect your issue tracker (e.g. Jira, GitHub) to pull in sprint data. Follow the installation instructions to complete the setup.
![]()