Your first ten days
Use this guide to establish a defensible activity baseline in the first ten days after your developers start setting up. You'll gauge how much of your team is reporting, identify coverage gaps, and build the work area views worth keeping.
- Deployment: SaaS, On-premises
- Role: Owner, Admin
The same sequence applies whether you are on SaaS or on-premises. The timeline differs slightly: SaaS organizations typically see first activity within hours of inviting developers; on-premises organizations see it after developers install the tracker through the workstation setup link.
1. Wait for data before building work areas
Work areas filter real activity. Building them before data arrives means you are designing views you cannot validate.
Until at least a handful of developers have completed setup, leave work areas alone. Focus on sending the workstation setup link and confirming developers are following it. See Onboard a developer.
2. Gauge coverage from Home
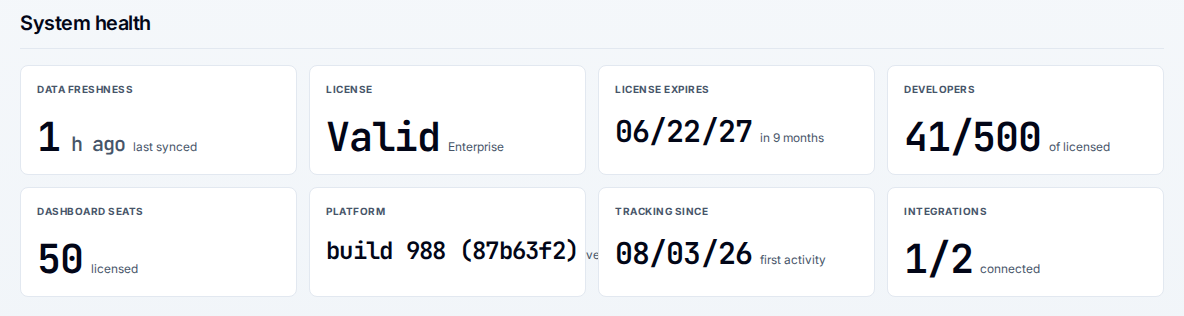
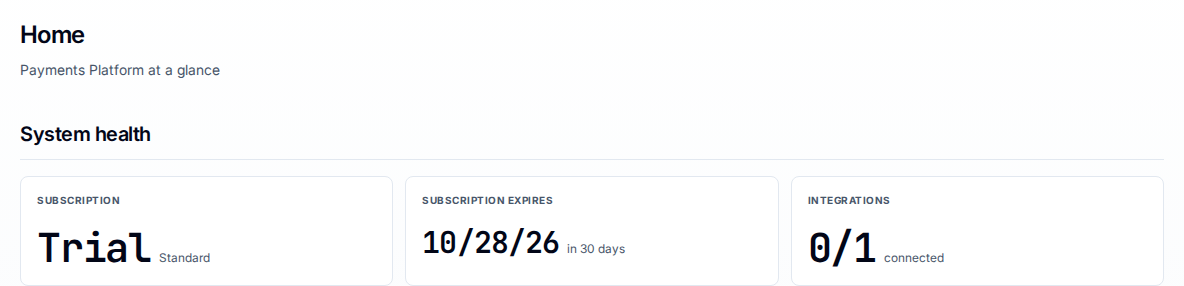
Once the first commits arrive, open Home in the portal and scroll to the System health section. On-premises, its Developers tile reads as a fraction — how many developers are actively reporting, over your licensed developer count. On SaaS, System health carries subscription and integration status instead, so read your coverage from a work area's Tracking tab. For administrators, System health renders after the activity and work-areas sections, at the foot of Home.
This is your first useful read: how many developers are reporting versus the headcount you expect. A developer who expected to appear but does not has either not completed setup or has a setup problem. Work through the roster until coverage is close to what you expect.
For a developer who stays absent after completing setup, see No activity appears for a developer.
Confirm who is reporting, tool by tool
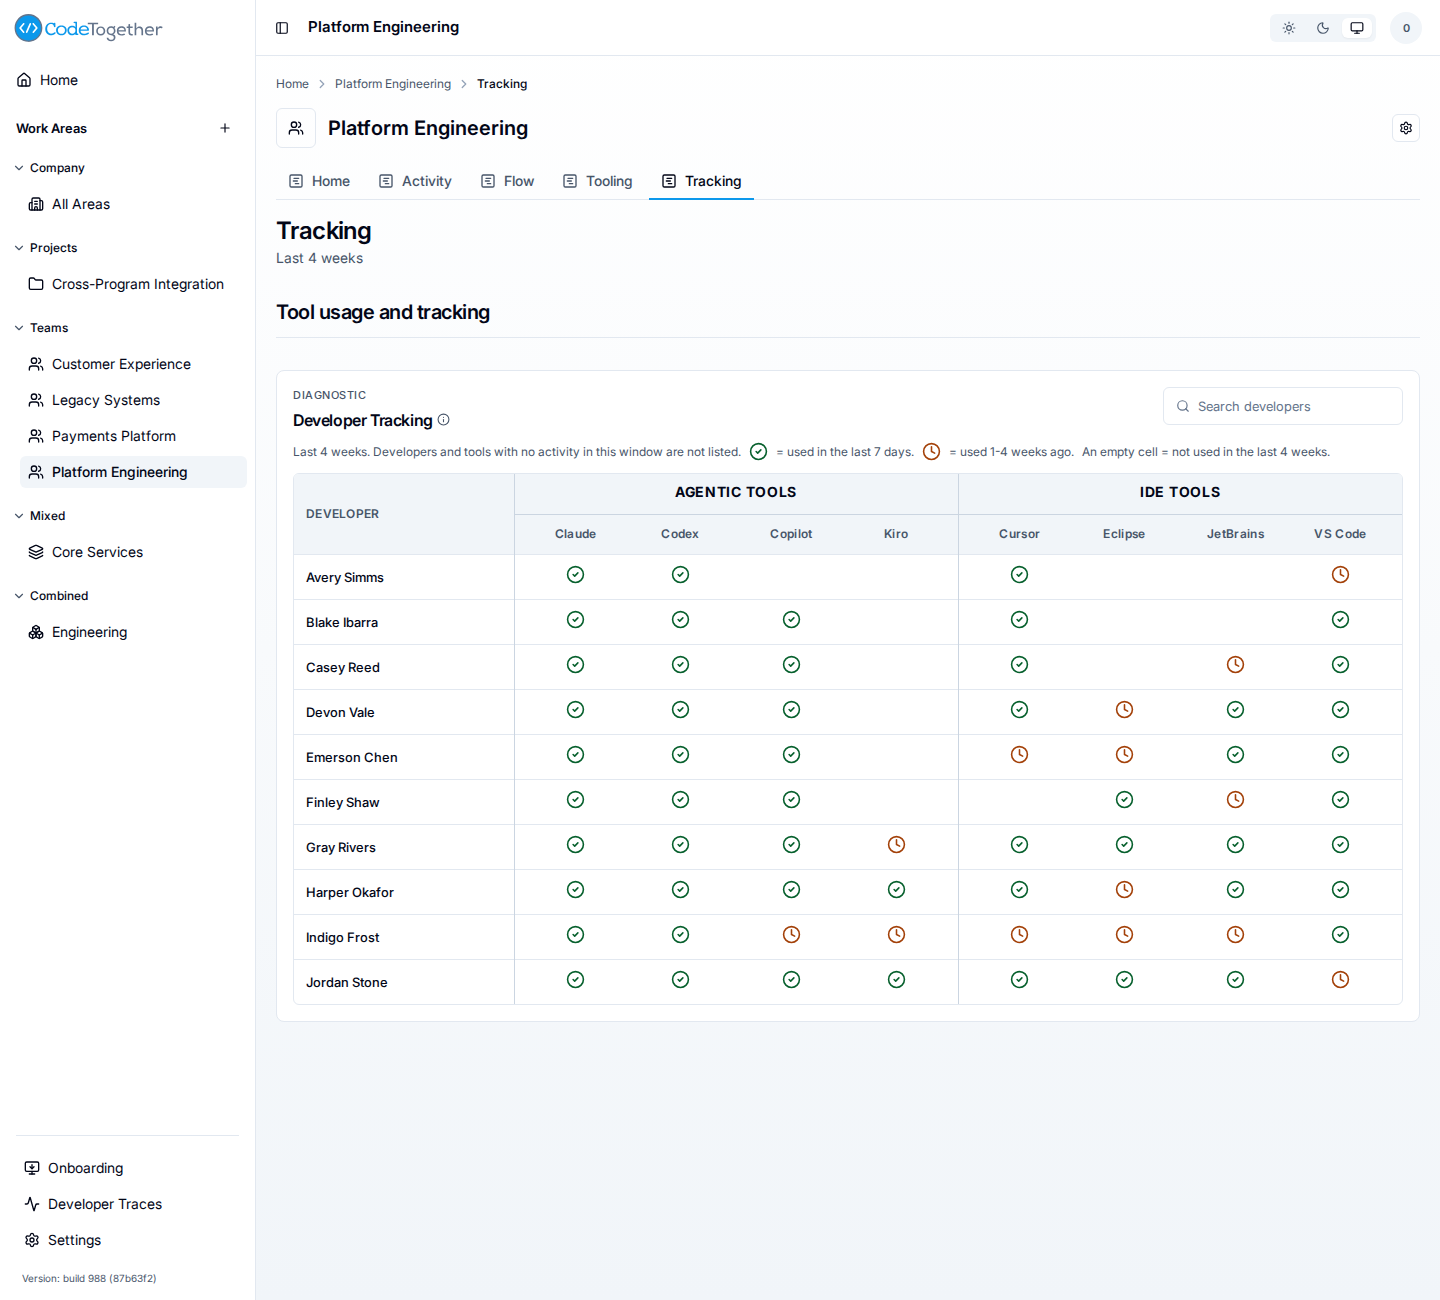
The Tracking tab answers the same question one developer at a time. Select a work area in the sidebar — on day one that is the automatically-provisioned All Areas — then select Tracking. Its Developer Tracking card lists a row per developer and a column per tool, grouped under Agentic Tools and IDE Tools. A green check means the developer used that tool in the last 7 days, an amber clock means 1-4 weeks ago, and an empty cell means the tool was not used in the last 4 weeks.
Developers and tools with no activity in the window are not listed at all, so a developer you expect and cannot find on this tab has not reported anything yet. The tab is visible to a work area's Owners and Admins, and to system Admins and Owners (Super Admins on-premises).
3. Read the AI adoption report at All Areas
Once a representative slice of your team is reporting, open All Areas in the sidebar and select the AI Adoption Report tab. The report runs at the All Areas level and shows who is using AI, how deeply, and what output per dollar — delivered output, measured in value points, against what it cost to produce — looks like across your whole organization.
This is your baseline snapshot — the figures before any work area tuning or value point configuration. Keep a note of the initial Output Efficiency figure — VP/$, or OP/$ where content analysis is off — and the Agentic developers percentage. These are the reference you compare against in future reporting periods.
A developer counts as agentic once agents author at least 25% of their attributable kept lines.
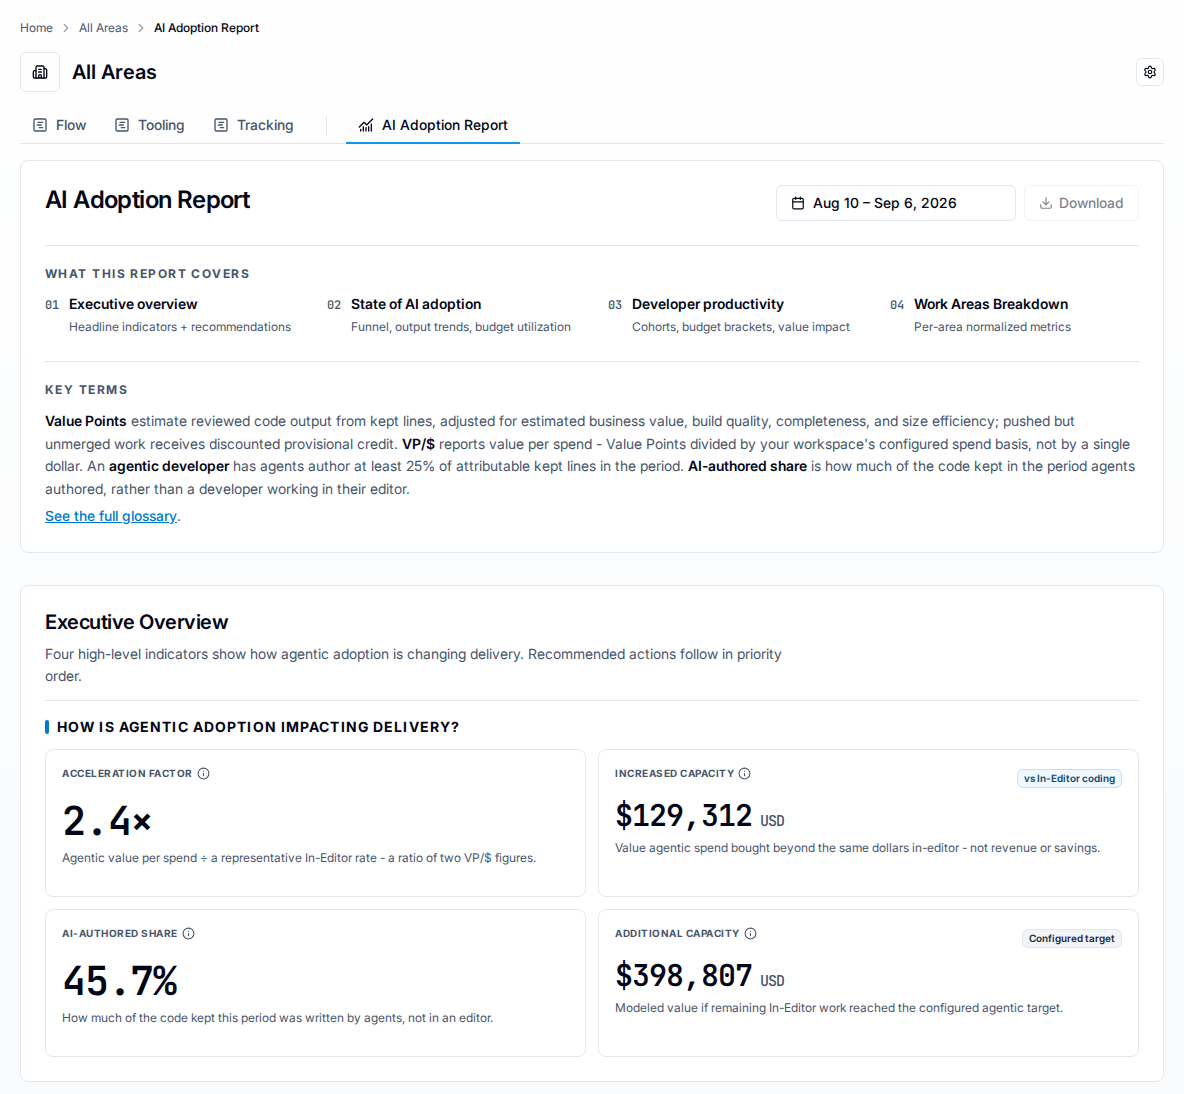
See AI adoption report for what each section measures and how the report is structured.
4. Build the views you want
By day seven to ten, enough data has accumulated to see the shape of your organization's activity clearly. The projects, teams, and reporting lines that matter are visible in the activity, so coverage decisions are grounded in something real rather than assumed.
For each slice you want to report on separately:
- Decide whether the slice is a project (a set of repositories), a team (a set of people), or a mix of both.
- Create a work area with the matching template. See Create a work area.
- Open the work area and confirm the activity looks right. A work area you create opens on its Home tab. An empty work area almost always means the coverage filter does not match the activity, not that access is missing.
Most organizations start with the automatically-provisioned company-wide work area and two or three project or team work areas. Add more as the reporting questions become clearer.
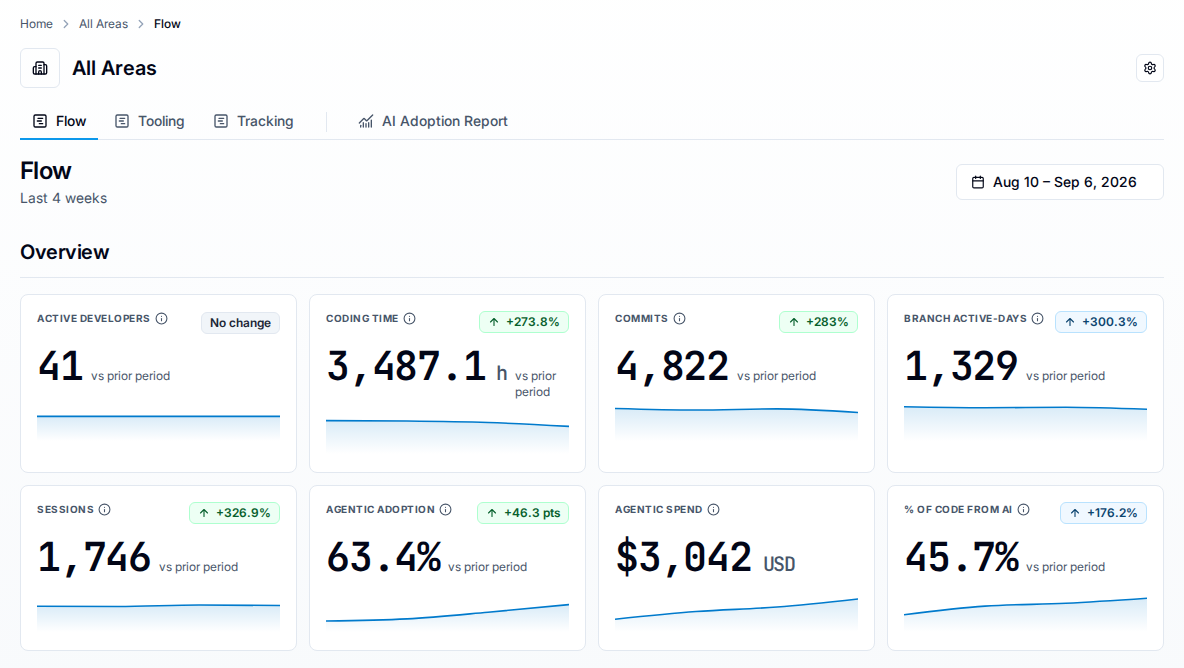
A work area's tabs are Home, Activity, Flow, Tooling, and Tracking. Flow is the delivery dashboard — headline metrics, trends, and the developer roster. Activity shows which parts of the codebase were worked on. The company-wide All Areas work area shows Flow, Tooling, Tracking, and AI Adoption Report instead: it has no Home tab, and it drops its Activity tab once you have created work areas of your own.
What to expect
The following table lists typical milestones:
| Stage | When to expect it |
|---|---|
| First developer reporting | Hours after tracker installation |
| Activity visible in dashboards | Same day |
| A defensible baseline, enough data to build targeted views | Day 7–10 |
These are typical figures. A larger organization takes longer to reach full coverage; a small team can have a defensible baseline inside a week.
Troubleshooting
A developer completed setup but does not appear in any work area or on Home
Activity processing is asynchronous. Allow a few minutes after setup completes before checking. If the developer stays absent after that, see No activity appears for a developer for a structured diagnosis.
A work area is empty but the developers completed setup
Membership does not add activity. Confirm the coverage filter — repositories or committer emails — actually matches the work those developers are doing. The committer email on a commit is not always the person's login address. See Work areas.
If this doesn't fix it
Contact support with all of the following. Tickets missing these take longer to resolve:
- The symptom: which screen looks wrong, and what you expected to see instead.
- How many developers have completed setup, and how long ago the first one did.
- For a missing developer: the editor they use and whether they completed the IDE-tab or Others setup.
- Your deployment kind and server version (shown at the bottom of the portal sidebar).
Related
- Onboard a developer — sending the workstation setup link and getting developers into capture.
- AI adoption report — the company-level executive report on adoption and output per dollar.
- Create a work area — defining coverage once data is flowing.
- No activity appears for a developer — diagnosing an absent developer.
- Work areas — coverage and membership, and why they are separate.