CodeTogether AI 2026.11.19 release notes
Release 2026.11.19 is about measurement. A tool is credited only for the code it was observed producing, content nobody was observed writing is a category of its own, and value points reflect what a change was worth rather than how many lines it moved. Almost every figure in the product moves as a result, and on an on-premises deployment the figures for periods you have already read are rebuilt. If you administer a deployment, start with Before you upgrade; Which figures move, and in which direction is the orientation for anyone who compares one month against another.
This is primarily an on-premises release, and it adds no new screen to the on-premises portal: what changed is what the screens you already have report, and how the deployment runs. SaaS changes are included and marked.
- Release: 2026.11.19
- Deployment: SaaS and on-premises, except where a change names one
- Role: any portal user, except where a change names a role
Red outlines in the figures are annotations that mark what changed. They are not part of the product.
Before you upgrade
Everything else on this page is a change you meet in the portal, on a workstation, or in the chart. These are the five that ask something of you.
- On-premises: upgrading restates your history. The figures for periods an administrator has already read are rebuilt, by themselves, over the whole history the deployment holds, the first time the upgraded server starts its analytics work. Value points, kept lines, AI share and agentic spend for past periods will differ from what you recorded before the upgrade. Anyone tracking any of these figures over time should start a new series rather than discover later that the baseline moved. See Upgrading on-premises restates the figures you have already read.
- On-premises: upgrade with
helm upgrade --reset-then-reuse-values. The chart now runs the container with a read-only root filesystem and mounts the five directories the server writes. With--reuse-values, Helm keeps your previous values and skips the chart's own defaults, so neither the setting nor the directories are rendered, the container goes on writing to its own layer, and the hardening silently does not apply - there is no error. See The container runs with a read-only root filesystem. - On-premises: if you mount your own volume, or run a pre-start hook, check it first. A
volume of yours on
/opt/ctai/runtime,/opt/ctai/www,/opt/ctai/logs,/opt/ctai/tmpor/tmpnow fails the render until you hand that directory over to it, and a hook that writes anywhere outside those five will fail. See The container runs with a read-only root filesystem. - On-premises: the shipped strategic focus prompt is replaced, in place. A deployment still on the shipped default picks up a new, much longer default when the upgraded server starts. A prompt you wrote yourself, or cleared, is left exactly as it is. If you want the old wording, save it as your own before you upgrade. See The strategic focus prompt takes 4,000 characters, and the shipped default is longer.
- Update any script that runs
aitrax uninstall repoor passes--repotouninstall. Both now exit with an error instead of printing help and reporting success, so a saved uninstall script or runbook breaks rather than quietly doing nothing. See Uninstall has one scope, and a retired command fails rather than passing.
Measurement: what moves, and which way
Upgrading on-premises restates the figures you have already read
Marked on-premises. This release changes how several numbers are produced, so the figures for periods you have already read are rebuilt rather than left as they were. The rebuild runs by itself, covering the whole history the deployment holds, the first time the upgraded server starts its analytics work. It takes a while on a large history, and a report read while it runs can show fewer periods than usual until it finishes.
Expect value points, kept-line figures, AI share and agentic spend for past periods to differ from what you recorded before the upgrade. The new figures are the ones the rest of this page describes.
Which figures move, and in which direction
- In-editor time, coding time and active time read lower for developers who work with an agent inside Visual Studio, a JetBrains IDE or Eclipse, and the agentic side of the agentic/in-editor split reads higher. Unattended agent minutes can rise, because a stretch of work credited to a developer and an agent together is now credited to the agent alone.
- Both the agentic and the in-editor line figures read lower on mixed work - work where an agent, an editor and content from somewhere else all contributed. The volume they lose appears as Imported/other instead of being shared out between them.
% AIon the Areas worked on table reads higher wherever imported content was present, because that content has left the denominator: the figure is the agent's share of the lines an agent or an editor was observed writing.- Agentic line figures and the agentic share read materially lower on projects where agents run installs, scaffolders or formatter sweeps, because the files such a command rewrites are no longer credited to the agent.
- Value points fall for work that was mostly a data drop, a regenerated bundle, or nothing but deletions, and rise from zero for teams whose workstations never reported a push. Ordinary source work does not move.
- Agentic spend falls for anyone who ran Codex helper agents on work captured by the older capture path, where the same tokens were counted again under every helper agent. Captured tokens and the spend derived from them also move for Copilot in the JetBrains IDEs, where the figures are now the counts the IDE itself reports rather than an approximation.
- A new third category, Imported/other, appears beside Agentic and In-Editor wherever the split is reported: lines committed that no agent or editor was observed writing - templates, copied or generated files.
Tracker changes and server changes reach your history differently, and anyone comparing one month against another needs this sentence: a change made on the workstation applies only to work captured after that workstation updates itself, so work already recorded keeps the figures it was recorded with, while a change made in the server restates history - on-premises, the whole history the deployment holds.
How code is credited
A tool is credited only for the files it was observed changing
Credit for kept code follows observation, file by file. Where more than one tool was active while a change was being made, each is credited only for the files it was seen to edit in that stretch of work - an agent for the files its edits named or its commands changed, an editor for the files that were typed in.
Code that landed in a file no tool was observed touching is no longer shared out between them. It is reported as Imported/other: lines committed that no agent or editor was observed writing - templates, copied or generated files. Earns heavily reduced Value Points. Work where nothing at all was observed stays unattributed, as it did. On a change that mixes an agent, an editor and content that came from somewhere else, both the agentic and the in-editor figures read lower than they did, and the difference appears as Imported/other.
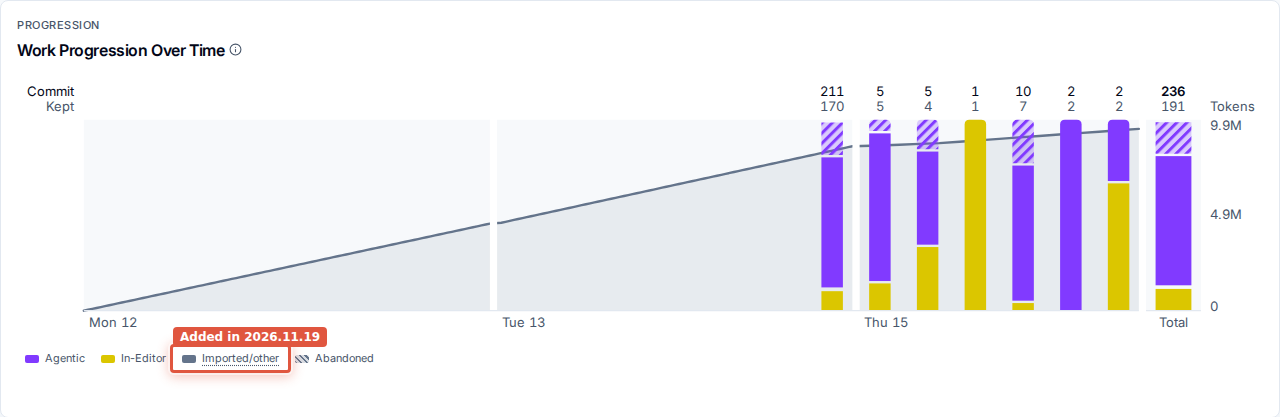
Work Progression Over Time carries an Imported/other series
The progression chart's third series is Imported/other, in neutral grey beside Agentic and In-Editor. It covers both the lines nobody was observed writing and the lines whose origin could not be established. It appears in the legend only when a commit landed some, and carries its own definition in the legend and in every tooltip; the per-commit and total tooltips gain an Imported/other column wherever a figure has some.
Areas worked on shows imported lines, and % AI reads against authored lines
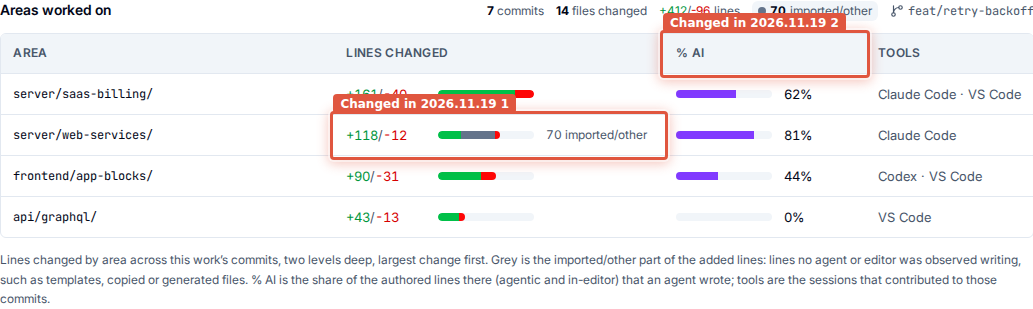
In the Work details drawer, each area's Lines changed bar shows the imported part of the added lines in grey with the count beside it, and a chip above the table gives the same figure for the whole piece of work. % AI is the agent's share of the authored lines in that area - agentic over agentic plus in-editor - so an area that is mostly template or copied content no longer reads as developer-written. An area whose lines are entirely imported reads Imported/other only rather than a percentage.
Compared with the month before, % AI reads higher in any area that carried imported content,
because that content has left the denominator.
The editor counts only the code a developer writes
An AI agent working inside Visual Studio, a JetBrains IDE or Eclipse used to be counted as hands-on coding: the agent's edits to an open file, and a file rewritten underneath the editor by a command line, a branch switch or another tool, all read as a developer typing. The editor now counts only the developer's own edits. Typing, pasting, deleting, accepting a completion, expanding a snippet and undo all still count; an agent's edits, a file reloaded from disk, a whole-file reformat, a refactoring and a replace-all do not.
In-editor time, coding time, active time and the in-editor half of the agentic/in-editor split therefore read lower for developers who work with an agent in these editors, and the agentic share of the same split reads higher. Unattended agent minutes can rise, because a block credited to a developer and an agent together is now credited to the agent alone. Adoption rates, session counts and agentic time are unaffected. This is a change of basis, not a drop in activity.
Behaviour is not identical in all four editors. Visual Studio additionally recognises the editor's own typing directly; Eclipse follows the primary cursor only, so typing at a second cursor far from it is not counted; and the VS Code plugin already counted only the developer's own edits. There is no gate and no setting - it applies as soon as the plugin updates. On-premises, your own deployment serves the plugins your developers install, so upgrade the server before expecting it.
A large paste or an accepted block is not hand-written code
A single edit that brings in at least 20 lines or 1,000 characters at once - a paste, a template, a large completion accepted in one go - is no longer credited to the developer as code they wrote in their editor. It counts as Imported/other unless something else was also observed changing that file; typing in the same file in the same stretch of work keeps the file credited to the editor.
In-editor line figures and the in-editor side of every code share read lower for anyone who works by pasting large blocks, and the AI share of the same work reads correspondingly higher.
Reading a file is not writing it
Opening, switching, scrolling and selecting in an editor count as the developer being present - they mark the work as observed - but they no longer earn a share of the code kept in that stretch of work. Only typing, pasting and undoing do. Reading through a file an agent wrote therefore no longer moves any of it onto the in-editor side.
An install, a scaffolder or a formatter sweep is imported content
When an agent runs a command that brings in or rewrites files it did not write - a package install, an unpack, a file copy, a patch apply, a scaffolder, a formatter or a codemod - the files that command changed are reported as Imported/other rather than as the agent's work. A compound command takes the strongest part of what it did, so installing a formatter and then running it is treated as one import. The recognition also survives a slow start: where the state of the files could not be established before the command ran, the command is still resolved against the last known state for up to a minute rather than the whole sweep falling to the agent.
On a project where agents run installs or format-on-save sweeps, agentic line figures and the agentic share read materially lower than they did.
A commit that brings in an existing codebase is recognised as an import
The first commit in a repository that drops in an existing codebase, and any later commit that lands a large body of content nobody was observed writing, are recognised as imports rather than as new work. An import's content is reported as Imported/other and earns heavily reduced value points instead of the full score for its size.
Recognition is deliberately cautious, so a real piece of work is not mistaken for an import: a merge, a commit made before tracking started, and anything that could not be fully observed are never treated as one.
A moved or renamed file keeps its author
Moving a file - with a rename, an IDE refactor or a directory move - no longer reads as writing it again. A file that only moved counts as neither new nor abandoned work, a file that moved and was edited counts only the edited lines, and its content stays credited to whoever wrote it in the first place. Where a move used to inflate a change's line counts, or show the same content as abandoned on one commit and unattributed on another, those figures fall to what actually changed. A deletion is still a deletion, and a real copy that leaves the original in place is still new content.
This applies to work captured after a workstation takes this release; work already recorded keeps the figures it was recorded with.
AI credit is bounded by what the agents produced
The kept code credited to agents in one session is bounded by how much output those agents reported producing in it. The allowance is deliberately generous - far above anything measured on real sessions - so it only takes effect where the kept code could not physically have come from the session's output. Anything over it is reported as imported content, never as agentic work and never as the developer's. A session that reported no output at all is unaffected and keeps the existing per-branch allowance.
In practice this only moves figures on work where a session committed a large body of content it did not generate.
What earns value points
The caps, allowances and exclusions the scoring model applies are stated where the number is read, and Value points is the concept page behind them.
Bulk data, generated and vendored files earn no value points
Value points now reflect what a change was worth rather than how many lines it moved. Lockfiles, minified bundles, generated code, snapshots and anything under a vendored or build-output directory earn nothing at any size. Data, log and plain-text content - data files, logs, text, JSON and YAML - earns its usual value up to 1,000 kept-line equivalents per piece of work; past that, the excess is treated as imported content and earns heavily reduced credit on a flattening curve rather than its full weight. Source files are unaffected.
A piece of work that was mostly a data drop or a regenerated bundle therefore scores far lower than it did. Ordinary source work does not move.
Deleting content is valued by what was deleted
Removing code still earns credit, and that credit now depends on what was removed. Taking out source code is unchanged. Deleting generated, minified, vendored or lockfile content earns nothing, as adding it does. Deleting data, log or text content draws on the same allowance per piece of work that added bulk content draws on, and anything past it earns the reduced imported-content credit. Deleting a file that only an import or a formatter had ever changed earns nothing. Work with no file-level detail behind it is valued as before.
A change that only deletes is not scored as though it wrote those files
A piece of work whose commits only delete is no longer credited as though it had written something for every file it touched. Where a change carries no line counts to score, the product falls back to a per-file floor, and that floor is now bounded for deletion-only work, so a change that removed hundreds of files is credited a small amount on that floor rather than as if it had added thousands of lines. Its credit for the lines it removed is unchanged. Work that both adds and deletes is unaffected, and so is work with no file-level commit detail behind it.
Work with no visible starting point is capped at the lines it added
Where the state a piece of work started from could not be established, most of every file it touched is credited as kept new lines. That credit is now bounded by the number of lines Git says were added, rather than by added plus deleted - such work was being credited around nine times the lines it added. Deletion-heavy work recorded this way falls the furthest, and work observed from the start is unaffected.
Value points for every piece of work are now sized on the volume that actually earns credit, which can only move a score back up toward what it would otherwise have been. An on-premises deployment already running one of the corrective builds on this line has this behaviour and will see no further change from it.
Work from a workstation that never reports a push is scored
A workstation that records commits but never reports a push used to leave every piece of work it recorded unscored, so the developers on those machines sat at zero value points however much they delivered. Such work is now scored as pushed-but-not-yet-merged, at the same reduced confidence as any work in that state, with its volume capped at 10,000 kept-line equivalents so a machine in this state cannot mint credit for a bulk drop. A workstation that has reported even one push is unchanged: its local work really is local, and stays unscored. Work whose volume could not be measured is not rescued.
Where a team has machines in this state, their value points, value per dollar and every figure derived from them rise from zero.
A prompt test says why it produced no figure
Marked on-premises. In the prompt test on the Output Analysis Policy card, a sample whose Recalculate ran but produced no score reads Unavailable with the reason underneath, instead of the same dash a sample shows before it has been tested at all. The reasons are Couldn't reach the AI provider. Check the AI integration settings and try again., The AI provider couldn't analyze this change., This change is too large to score. and This change couldn't be priced with the draft prompt. The Current value is unaffected, an untested sample keeps its dash, and a test in flight still shows its in-progress state.
Reading the numbers in the portal
Agentic spend reads in whole dollars
Agentic spend is shown in whole currency units everywhere it is read as a figure in its own
right: the Agentic spend tile on a work area's home screen, the same tile on a developer
profile, the spend on a Recent work card, and the Agentic spend tile in the Work
details drawer. A figure that read $52.313 reads $52, and $118.42 reads $118 USD.
Spend below one unit reads <$1 rather than $0, so real spend never looks free, and a
measured zero still reads $0.
The cents were never worth reading: the figure is an estimate priced from captured tokens.
Nothing about the underlying amount changed, so a comparison against the month before differs
only by rounding - up to half a unit either way, and more where a figure used to carry three
decimal places. Delivery costs are unaffected and still read to the cent, with a cost below a
cent reading <$0.01.
A window that ends today reads correctly west of UTC
A date range ending on today now reads for a reader whose browser time zone is behind UTC. The time measures - Coding time, Active time and the per-tool figures - are asked for over the days the analytics have actually been built for, on company and on repository scopes alike, and the weekday-by-hour activity heat map is judged on the reader's own local days. Nothing changes for a reader on or east of UTC, and no figure's definition moved.
Branch patterns read exactly as you type them
Typing a branch pattern into Settings > Delivery Tracking → Integration branches could
paint the slash out of it: a typed release/** appeared as release ** until something redrew
the field, though the pattern being saved was always the one you typed. Programming ligatures
are off wherever the dashboards use their monospace face, so patterns, branch names, globs,
paths and identifiers all read exactly as typed - in the pattern rows, in Test a branch
name, and in monospace text elsewhere in the portal. Set integration
branches is the how-to for the patterns themselves.
AI tools and sessions
Copilot helper agents in JetBrains IDEs are counted
Helper agents that Copilot runs inside a JetBrains IDE are captured with the rest of the session: their prompts, their tool calls and their token figures. The model behind a helper agent's turn is reported as the model the IDE had active when the turn began, and is left blank rather than guessed where that cannot be established. A helper agent is reported on its own rather than tied to the conversation that started it, because nothing on the workstation records that link.
Prompt counts, tool-call counts and captured tokens for Copilot in JetBrains IDEs all read higher than they did.
Copilot in a JetBrains IDE reports the IDE's own token counts
Token counts for Copilot chat and agent work inside a JetBrains IDE are the counts the IDE itself reports for each turn, where every turn previously carried an approximation. Cached input is reported too, where before there was no cache figure at all. Token figures, and the AI spend derived from them, therefore move for developers using Copilot in a JetBrains IDE - this is an accuracy change, not a change in how much they used.
Where the IDE does not name a turn's tokens - two turns resolving together, two IDEs running at once - the approximation remains, and the model, prompt counts and tool calls are reported exactly as before. This one is in the tracker alone: it needs no IDE plugin update and no server change.
AI chat in a JetBrains project is credited without a line being typed
A Copilot chat in a JetBrains project where the developer had only chatted - the agent making all the edits - was recorded against no repository and then discarded, so the prompts, turns, tokens and spend of that work reached nobody. The project's own content now decides which repository a chat belongs to, so chat-only work is credited from the first turn. A file opened from an unrelated repository inside the project no longer confuses that decision, and a repository the project no longer holds drops out instead of lingering.
Developers using Copilot in a JetBrains IDE may therefore appear with AI sessions, prompts, tokens and AI spend where they previously showed none. Both halves are needed - the current IDE plugin and the current tracker - and on-premises your deployment serves the plugins, so upgrade the server first.
Each VS Code window's AI chat is credited to its own project
With several VS Code windows open, every window's Copilot chat used to be credited to whichever window happened to carry the connection, and a single stray file from another repository could attach a window's chats to the wrong repository. A window's own folders now decide where its chat belongs, a multi-root workspace is narrowed to the repository actually being worked in, and a chat is always credited to the window it came from. A window whose project cannot be identified is left unattributed rather than credited to the wrong one.
On SaaS, a chat that could not be placed was not recorded at all, so this is work appearing where there was none; on-premises such chats were recorded against the wrong repository, so this is work moving to the right one. A multi-root workspace with work in several of its repositories, or in none yet, still has no single answer and stays unattributed on SaaS. It needs the current plugin and the current tracker.
Edits are tied to the agent that made them, for every agent
The per-agent edit tracking that covered some agents now covers all of them. Each agent's structured edits, and the files its commands changed, are recorded against that agent, so where two agents, or an agent and an editor, were working at once each is credited with its own files rather than sharing them out. Copilot Chat running inside VS Code is bound to its own chat session rather than being read as the command-line tool, so its prompts and tool calls land on the right session, and Visual Studio 2022 sessions are bound to their window. A shell command an agent runs is recognised by what it does, so a read-only command records nothing while a command that changes files names exactly the files it changed.
An agent's edits are counted only from the point this release begins recording them on that workstation.
Codex helper-agent sessions no longer restate their parent's tokens
Where Codex was captured by the older capture path, a helper-agent session restated the whole conversation's token usage, so the same tokens were counted again under every helper agent and the agentic spend of anyone who used them read several times what the provider bills. Such a session now counts no tokens and no spend; the top-level session keeps its own, complete figures. A helper-agent session whose parent conversation was never captured keeps its usage, because it is the only record of that conversation.
Session counts, prompt counts and tool-call counts are unchanged. Captured tokens, agentic spend, cost per value point and value per dollar all move for Codex users recorded this way, and because the bound on AI credit reads the same figures, some of that work's agentic value points move with them. Codex captured by the current path is unaffected, as is every other tool.
A session's figures survive a slow repository read
A single slow or failing read of the current branch used to be recorded as a real branch change. Everything captured during the gap, and everything behind it in the same conversation, was held and then discarded - a session could lose its tokens, its model and every one of its tool calls to a hole of a few seconds. A read that did not happen is no longer treated as an observation: the current branch is kept as last seen, the failure is recorded in the workstation's own diagnostics, and the session's data survives.
Captured sessions, prompts, tool calls and tokens for developers in JetBrains IDEs read higher as a result.
AI work is measured when a tool keeps its configuration elsewhere
AI work done by a command-line agent whose own configuration or storage lives somewhere other than the default - a relocated configuration directory, or an agent running under a separate home as a sandbox or container user - is measured. Such sessions produced nothing at all: no session, no prompts, no tokens, and the files they changed counted as work of unknown origin. This covers Claude Code, including its helper agents, and the GitHub Copilot command line. Nothing is searched for: only locations the tool itself names are measured, and nothing about where a location is or what it holds leaves the machine. Codex is not covered.
The workstation and the command line
The tracker for this release is 1.2.8793
Workstations that update from a 2026.11.19 server report tracker version 1.2.8793, not
1.2.8821. A tracker takes a new version number only when the tracker itself changes, so its
number trails the server's: 1.2.8793 is the current tracker for this release, and a
workstation reporting it has not missed the update.
A repository cloned without its full history is measured
A working copy cloned without its full history - a build agent, a CI runner, any shallow clone - produced no sessions and no commit attribution at all, and nothing looked wrong while it did. Such a clone is now identified from the repository it was cloned from, so its work is recorded. Where the same repository is also present with its full history, the two are brought together automatically, including for work already collected, so one repository does not appear as two. Features that need the full history still wait for it: completing the clone's history switches it to the ordinary identity the next time the tracker's background program restarts.
aitrax health reports which working copies are in this state under a new REPOSITORY
IDENTITY section, beside the capture report Verify your
installation walks through. It never changes the verdict:
this is a supported mode with coarser attribution, not a failure. Nothing changes about what a
workstation uploads - a clone of a repository outside your collection scope still uploads
nothing.
Uninstall has one scope, and a retired command fails rather than passing
Tracking settings are user-level only, so aitrax uninstall has one scope. The repo
subcommand and the --repo option are gone, and uninstall all is an alias of uninstall system. An old command - aitrax uninstall repo, or uninstall all --repo <path> - exits with
an error rather than printing help and reporting success, so a saved script or runbook that
used either needs updating. The options uninstall accepts are --home, --login-task-path,
--verbose, --dry-run and --keep-cache.
The aitrax command line lists the surviving forms. The setup command
the portal gives a developer has not changed, and --repo is still accepted and ignored on
setup and doctor, so an IDE plugin that passes it keeps working. A repository that carries
settings written by something other than setup - a post-commit hook entry, an agent instruction
file - is cleared by hand.
aitrax uninstall also removes the aitrax entry from Kiro's own tool configuration, so Kiro
no longer tries to launch a tracker that uninstall has just removed. Other entries in that
configuration are left alone, and a file that has been hand-edited into something unreadable is
left untouched and reported as skipped rather than rewritten. --verbose lists the step as
Kiro MCP, and --dry-run shows it as a removal it would make.
A workstation with no Git email configured still reports its pushes
A workstation with no email set in its Git configuration reported no pushes at all, so none of its work ever counted as delivered and none of it was scored, while everything else about the workstation looked healthy. The push is now reported under the email stamped on the commit itself, which Git resolves from more places than the plain setting, so such a machine records its work under the right developer. Where no commit on the branch names a usable address, the push is left for a later attempt and the reason is recorded in the workstation's own diagnostics.
The tracker stays up when a Copilot command-line session ends
The tracker's background program no longer goes down when a GitHub Copilot command-line session ends. On macOS and Linux, ending such a session used to stop it, and it then started again on the next AI activity, so a workstation sent nothing in between. Windows was never affected. The change is in the shared path, so it holds for any host that stops a tool server by its process tree.
A workstation that stopped reporting recovers by itself
A workstation whose tracker met a particular piece of its own saved state could fail every time its background program started, so it stopped capturing and uploading permanently - with nothing on the machine saying so, and nothing in the portal except a developer who went quiet. Start-up now recovers that state, and a tracker that meets a record written by a newer build than its own skips it instead of refusing to start. An affected workstation resumes on its own once its tracker updates; self-update is driven by the tracker's own launches, so a wedged background program never blocked it.
Visual Studio starts tracking without holding up the IDE
Visual Studio no longer stalls while tracking starts. Setting up, connecting and updating begin once a solution has finished loading and run clear of the editor, so opening a solution, or opening the Help menu moments after Visual Studio starts, is not held up by them.
Two consequences are worth knowing: the Enter AITrax Activation Code item appears once the IDE is idle rather than immediately, and a project in a second repository that the solution has not loaded is no longer discovered when the solution opens - its repository is picked up on the first edit in it instead.
Connecting an AI provider (on-premises)
Connecting a provider for AI analysis yourself is on-premises only, so everything in this group is marked on-premises. Connect integrations is the how-to.
Ollama and a custom endpoint run the same analysis as the hosted providers
A provider configured as Ollama or Custom (OpenAI-compatible) runs the same multi-step analysis the hosted providers run - per-file interpretation, a synthesis, then separate quality, completeness and business-value evaluations - instead of a single pass per change.
The model you point at must support tool calling for the full analysis. A model that refuses it is still used, falling back to the single-pass analysis for the next hour, so a model that later gains tool support is picked up without a configuration change. Extended thinking is applied by model family, so a gateway that presents your model under a renamed alias will not use it.
For a modest or CPU-only local model, expect more calls per change: up to 40 files interpreted, up to 40 synthesised, five workers, and a 60-second limit per call. The single-pass mode remains available as a configuration setting.
A provider that serves the responses path, and a reasoning model, both work
An OpenAI-compatible provider is called on whichever interface it serves. A gateway that exposes only the responses path is used for every call once the chat-completions path answers that it does not exist, and a reasoning model is called in the way it accepts rather than being refused. This is what makes the full analysis work on the shipped OpenAI default and behind a gateway in front of a reasoning model. A provider's refusal of one request shape is remembered only once another shape has worked, so a configuration change or a server restart starts the decision again.
What this asks of you: a custom gateway must serve either the chat-completions path or the responses path under the base URL you configure.
A provider on your own network is accepted
An AI analysis provider may sit on a private or internal address - an in-network gateway, or a
model host on a private subnet - which is the ordinary on-premises arrangement. This is the
default; nothing is needed to enable it. Cloud metadata, link-local, wildcard and multicast
addresses stay blocked, and the strict check can be restored by setting
CTAI_AI_EGRESS_ALLOW_PRIVATE_ADDRESSES=false. Every provider except Ollama still requires
TLS, so an internal endpoint must terminate HTTPS.
A base URL that already ends in the version segment is no longer given a second one, so both forms of a gateway address work. The same setting governs Test and the analysis itself, so a provider that tests cleanly also scores. SaaS keeps the strict check.
Test connection says why it failed, and what a pass does not prove
Testing a provider that cannot be reached shows the reason beneath the Failed pill - a certificate problem, a refused connection, a connection that timed out - with the full text on hover, where before it only said the probe had failed. The result is the panel's own view of the last test you ran, so it reads Not tested again after a reload, and the message under the pill is worth quoting in a support request.
What Test establishes is narrower than it looks: it asks the provider for its model listing and reports Passed for any answer that is not an authentication failure. It does not run the analysis, so a green result does not prove the analysis can run - a gateway that answers on neither the chat-completions nor the responses path still tests Passed.

The strategic focus prompt takes 4,000 characters, and the shipped default is longer
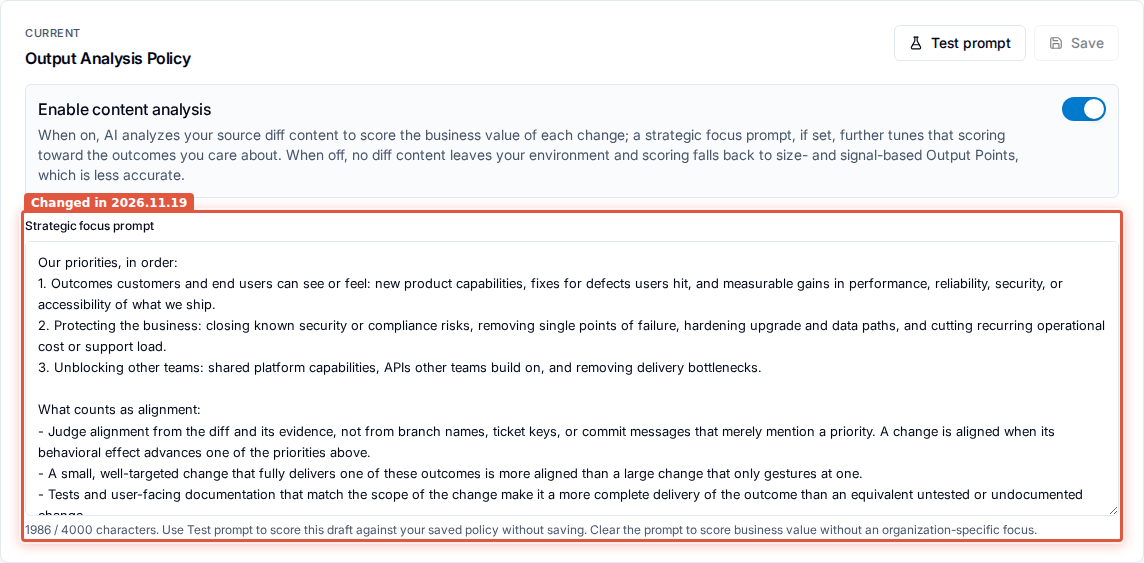
The strategic focus prompt takes up to 4,000 characters instead of 600, the field is taller, and its counter reads against the new limit. Test prompt refuses a draft over the limit rather than scoring a shortened version of it.
The prompt the product ships with has been replaced by a much longer one: ranked priorities, what counts as alignment, what is treated as neutral, and what leans negative. A deployment that wrote its own prompt - or cleared it - keeps exactly what it has. A deployment still on the shipped default picks up the new text, in place, when the upgraded server starts; if you want the old wording, save it as your own first. The new default deliberately uses under half the budget, so it is written to be extended section by section rather than replaced. Reset to defaults rejoins the managed-default pool, so later default changes track automatically again. Tune value points is the how-to.
Developer identities
Reports stay visible after a link made with a history window
Linking two of a developer's identities and choosing anything other than All retained history could leave every analytical read for the whole organization empty - dashboards, Activity and reports - with no error and nothing to clear it, even though the directory showed the developer as linked and data kept arriving. That no longer happens: a link counts as a link whichever history you chose.
The window you chose still decides what is merged, so activity outside it continues to be presented under its separate identity, which is the honest presentation rather than a blank organization. Reads come back as soon as the upgraded server is running - no re-link, no recalculation - and nothing about counting or merging changed. Members and developers describes the four histories a link can be given.
A link that already exists is not reported as a problem
An identity pair an administrator had already linked by hand could be reported as a refused automatic link - a warning asking the administrator to look at something that was already correct - and retried indefinitely behind it. A pair that is already linked to the right developer is treated as satisfied: nothing is rewritten, the history window and the member you chose are kept, and the warning no longer appears. A real conflict, where the two identities sit on two different developers, is still reported. Existing reports clear themselves after the upgrade. The warning itself is shown on-premises only.
Starting on SaaS
Set up your organization in a guided flow
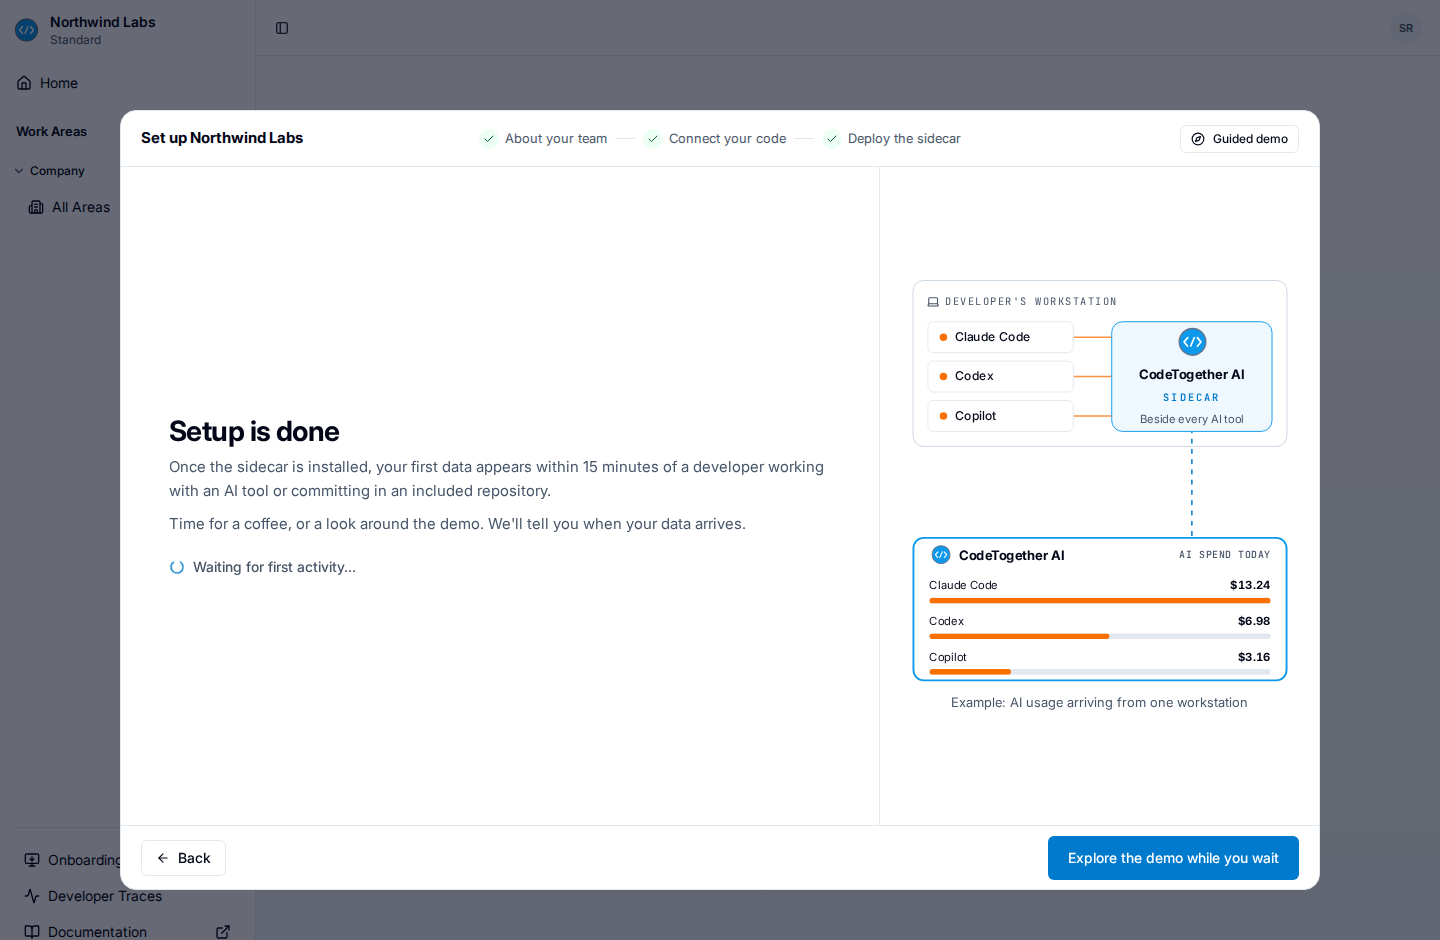
Marked SaaS. Owner and Admin. A new organization opens on a guided setup flow rather than on an empty dashboard. It is a dialog over the dimmed portal, titled Set up <your organization>, with a named stepper across three steps - About your team, Connect your code and Deploy the sidecar - and it is where the whole first run now happens: what your team is hoping to achieve and which AI tools it uses; the repositories to include, through the GitHub App or by organization, prefix or clone URL; and the activation code and per-IDE install steps for the first workstation.
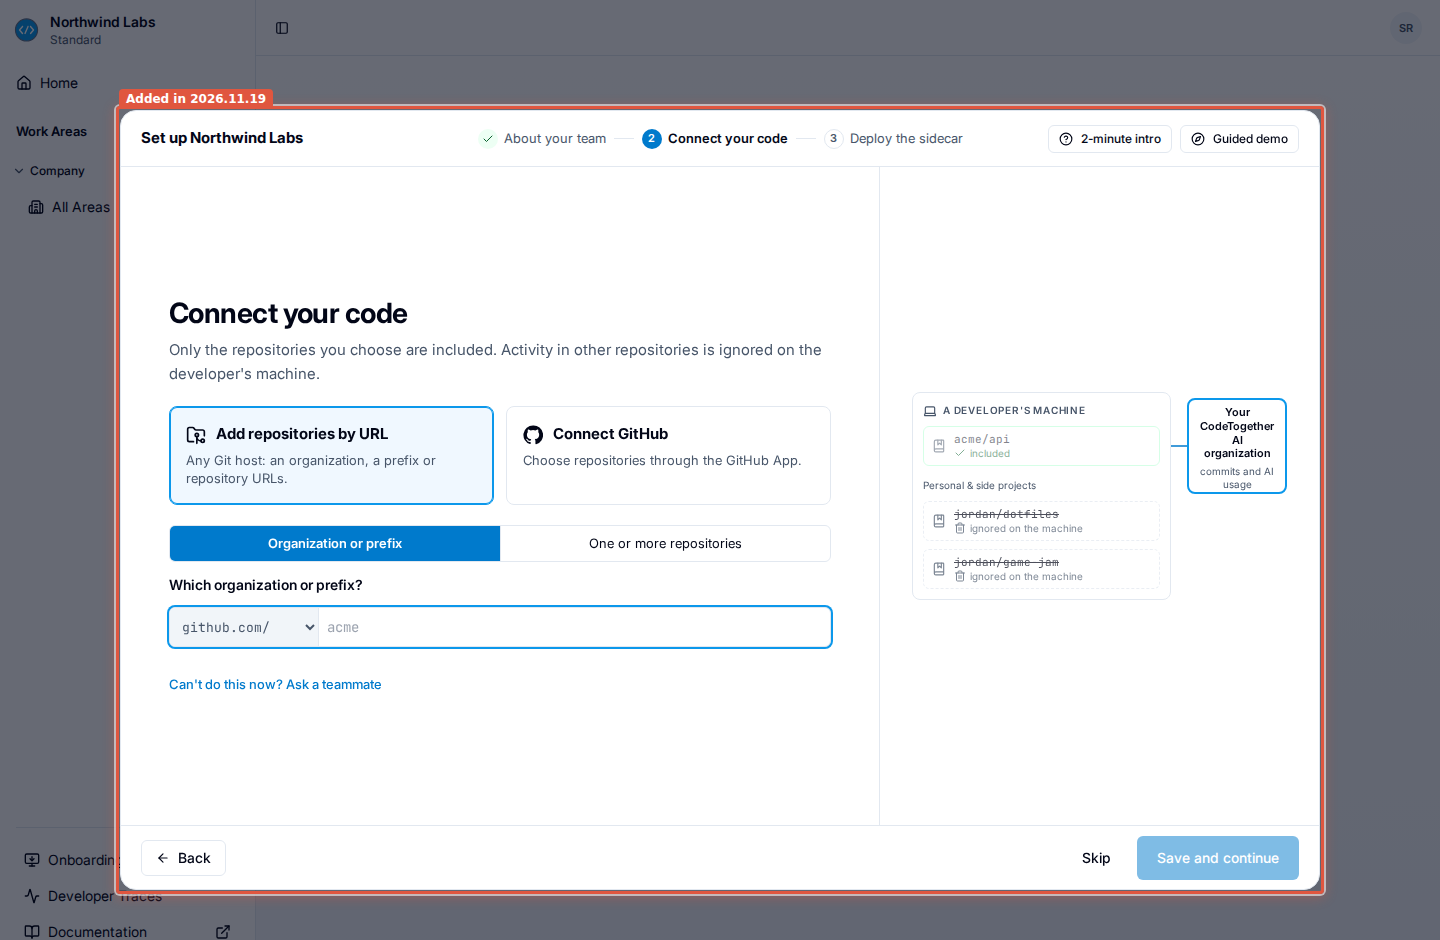
It ends on Setup is done, which waits for your first activity and says it arrives within 15 minutes of a developer working with an AI tool or committing in an included repository. The flow opens by itself for an Owner or an Admin of an organization that has never sent any tracker data, and it remembers where you left off; anyone else who reaches it is taken to the dashboard. Once your first activity has arrived, the portal opens on the report that matches the first goal you checked. Set up your organization on SaaS is the how-to.
A two-minute intro
Marked SaaS. Owner and Admin. From the opening screen, or from the 2-minute intro button in the dialog's header, there is an optional four-screen intro - Why, Insights, How it works and Privacy - that plays itself, one point at a time, and can be paused or skipped straight to setup. Which story it tells varies: one opens on what AI work is worth, the other follows a single afternoon of AI work, and a browser keeps whichever it was given. The Privacy screen is word for word the same in both. With reduced motion every transition is instant and nothing advances on its own.
Explore the product on sample data while you wait
Marked SaaS. Leaving the setup flow before your first activity arrives opens the portal on sample data - a fictional organization with a full set of dashboards - so there is something to read while the first workstation reports in. A Guided demo · sample data bar runs across the top with a nine-stop tour of an engineering manager's reading of the product, each stop opening the page it is about and offering Next stop, Skip and Take me there; Back to setup returns to where you left the flow. The bar takes the place of the Setup guide panel for as long as the demo is up; the panel keeps the remaining steps to hand once your own data arrives.
Nothing here can be changed - an edit answers that this is sample data - and the set is marked wherever it could be mistaken for your own: a Sample data pill naming the fictional organization and its developer count, and a Sample data · fictional organization line on anything printed or saved as PDF. The moment your first activity arrives the portal says so and offers Switch to your data. Sample data opens only for an organization that is still setting up, and nothing is collected from it. Owner and Admin get the bar and the setup guide; anyone else who reaches sample data gets the pill with Exit sample data.
A ready-made message for your developers
Marked SaaS. Owner and Admin. The box that hands a developer their setup carries a third tab, Invite message, beside Setup link and Activation code. It holds a prewritten, editable note explaining what the product is and how to install it, with your setup link and activation code already in it, and offers Copy message and Open in email. Edit it and Save for my organization to make it the message everyone in your organization starts from; the link and the code are filled in again for whoever shares it next, including after the code is regenerated. Discard edits drops an unsaved change, and Use the default message goes back to the shipped wording.
Finishing a GitHub connection the app already has
Marked SaaS. Owner and Admin. Connecting GitHub no longer dead-ends when the CodeTogether app is already installed on the GitHub account you pick. GitHub skips its install page in that case, so the portal takes you back to GitHub once more to confirm the existing installation, saying it is doing so. A connection left unfinished carries an Already finished on GitHub? notice with Finish connecting, which finds the installation among the GitHub accounts you administer; where you administer more than one that has the app, Choose the GitHub account to connect lists them. Three refusals name what went wrong: no installation on an account you administer, an installation already connected to another organization, and a choice that has to be made.
Add a repository without leaving the page
Marked SaaS. Owner and Admin. Wherever a work area's repository coverage is chosen - the Create work area wizard, and a work area's settings drawer - an Add repository link sits under the picker, under "Not listed? Add a repository to start tracking it." It opens the same form the repositories page uses, prefilled with whatever you had typed, so a repository the picker does not know yet can be declared and selected in one pass instead of abandoning the wizard. A single repository added this way is selected immediately; an organization or prefix entry reports Repository tracking updated and that its repositories will be listed once activity arrives. The first step of the setup guide keeps an Add repository button beside Refresh status too. On-premises tracks every repository it sees and never offers this.
A billing problem says who can fix it
Marked SaaS. The notice over a billing problem - the banner above every page, and the one on Settings > Billing - says what is happening and who resolves it. While a failed payment's grace window runs it states that dashboards show sample data until billing is resolved, and gives the date until which your activity keeps being collected and processed. Where your account team has granted a grace period, your organization keeps full access to its reports until the date they chose, and the notice says so. Where reports are locked on an arrangement the account team manages, the notice no longer tells you to update payment details: it reads Reports are locked. Contact your account team to restore full access to your organization. and its action only opens the billing page. Everyone in the organization sees the banner; someone who cannot manage billing gets it without the action.
A workstation whose organization has connected no repositories says so
Marked SaaS. An activated workstation whose organization has not connected any repositories yet collects nothing, and now says so instead of looking healthy. The IDE shows a notice at startup and after a successful activation, the command line prints a warning after setup, and the workstation's own health report leads with it. The notice carries the consequence - that the lost activity is not recoverable - and that only an administrator can change it: a developer cannot widen it from their machine. A dismissed notice stays dismissed until the organization's repository coverage changes. The ordinary window between activating a workstation and its first successful check is deliberately silent, because it resolves itself.
On-premises deployment
The container runs with a read-only root filesystem
The chart runs the server with a read-only root filesystem, so the image's binaries, scripts and
configuration cannot be altered from inside a running pod.
securityContext.readOnlyRootFilesystem is true by default, and the five directories the
server does write are mounted for it:
| Directory | What the server writes there |
|---|---|
/opt/ctai/runtime | The artifacts unpacked at start, about 200 MB, and the configuration generated from your properties file |
/opt/ctai/www | The portal's own files, unpacked at start |
/opt/ctai/logs | The server and web-server logs, and heap dumps |
/opt/ctai/tmp | The web server's pid file and its request-body and proxy temporary files |
/tmp | The JVM's and the servlet container's temporary files |
Each is an entry under writableDirectories with its own enabled (true) and sizeLimit
(unset, so uncapped; set one and the kubelet evicts the pod when it is exceeded). They live as
long as the pod, as the container's writable layer did, except that a container restart now
reuses what was already unpacked - and only the newest heap dump is kept under the logs
directory now that it survives a restart.
To keep one of them on storage of your own - a claim for the logs, typically - set that entry's
enabled: false and mount your volume on the same path with extraVolumes and
extraVolumeMounts. The chart stops rather than let two volumes contend for one path, or leave
a disabled directory read-only, so a mount of yours on one of those five paths fails the render
until you turn that directory over to it. Setting
securityContext.readOnlyRootFilesystem: false restores the previous layout, which is what an
older image, or a pre-start hook that writes elsewhere, needs.
Install with Helm carries the install and upgrade procedure.
Two things follow for an upgrade. Use helm upgrade --reset-then-reuse-values: with
--reuse-values the setting and the directories are never rendered and the hardening does not
apply, with no error to tell you. And install the chart and the image from the same package - a
chart from this release pinned to an older image needs
securityContext.readOnlyRootFilesystem: false.
Add this release's HTTPS listener to a shared Gateway
On the Gateway route the chart can contribute its own HTTPS listener to a Gateway you already
run, so a shared Gateway needs no listener edited for each application it fronts. Set
gateway.listenerSet.enabled=true with gateway.listenerSet.parentRef naming that Gateway's
name and namespace. The chart then renders a listener for your service hostname -
listenerSet.listenerName (https) on listenerSet.port (443) - terminating TLS with
listenerSet.tlsSecretName (the release's own <name>-tls by default), and the HTTPRoute
attaches to it whenever gateway.parentRefs is empty. It is off by default, and an explicit
parentRefs still wins.
What this route needs from your networking team differs from the plain Gateway route: Gateway
API v1.5 or later with the standard resources installed, and a Gateway whose allowedListeners
admits this namespace. There is no existing listener for them to name. A cert-manager issuer
annotation in listenerSet.annotations has cert-manager issue the certificate into that Secret,
on cert-manager 1.21 or later with its own listener support turned on. A listener set you
created by hand under the same name can be taken over by the release rather than replaced,
keeping the certificate it already holds.
A hardened container base
The server image is built on a minimal, security-maintained base rather than a general-purpose Linux distribution, and carries only what the server needs. The account the container runs as is unchanged, so existing volumes keep their ownership, and so are the locale and the system time zone.
It matters in one place: if you build your own image on top of ours, or run a pre-start hook. The
package manager is apk rather than apt-get. bash, the GNU text and file utilities, perl,
curl, unzip, xz, the process tools, the web server and the full JDK are present, and tools
a general-purpose distribution happened to ship are not. /bin/sh is a minimal shell, so a hook
that needs bash must say so in its interpreter line, and accounts are created with the
minimal-shell tools rather than useradd.
Replicas that start together form one cluster at once
On a deployment with more than one replica, pods that start at the same time - after a full
restart, or a Recreate rollout - join each other immediately instead of each running alone for
several minutes until they found one another. A member registers itself before it joins, drops
its registration on a graceful stop, and reports in after a minute rather than six, so
ctai.hazelcast.heartbeat-initial-delay defaults to PT1M rather than PT6M, inside the
three-minute liveness window ctai.hazelcast.node-ttl keeps. There is nothing to set: the new
defaults apply when the pods restart.
A long report rebuild is no longer abandoned
On a large dataset the repair lane of the reporting rebuild could take longer than the ceiling it
was given, so it was cancelled and retried indefinitely while the reports it feeds stayed stale.
That lane's ceiling is two hours (ctai.marts.runtime.repair-statement-timeout, PT2H), and a
rebuild whose step is still running keeps its claim instead of being handed to another replica,
so these rebuilds finish. The scheduled lane's ceiling is unchanged, and a timeout you pinned by
hand is kept.
Security updates inside the server image
The image carries current versions of its Java libraries and operating-system packages, and the dependencies a vulnerability scan flagged on the previous release line have been raised or patched. Nothing changes in how the server is configured or run. The same dependency set ships in the hosted service.
Behind the scenes: reliability and performance
None of these change a screen. They change whether a screen answers.
- An organization's analytical reads no longer wait on an internal background pass over retained identities. That pass used to hold every read while it was incomplete - and for ever if it had never started, which showed as a blank Activity page and empty dashboards with data arriving normally and no error. The hold is bounded to fifteen minutes, and a pass that has not started holds nothing. It clears on restart.
- A single failure in that background work no longer stops it for a whole deployment: it is reported and runs again at its next interval. (SaaS.)